


Packet Tab
576
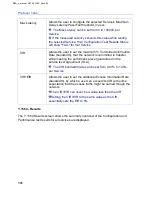
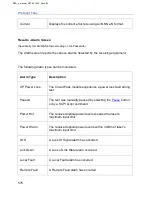
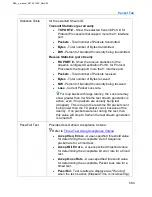
Jabber Condition
A Jabber alarm has occurred, which could be caused by a
device that is handling the electrical signals improperly.
10/100/1000BaseT ports only
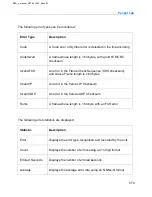
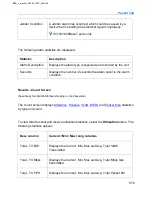
The following alarm statistics are displayed:
Statistic
Description
Alarm Description
Displays the alarm type recognized and recorded by the unit.
Seconds
Displays the number of seconds the alarm spent in the alarm
condition.
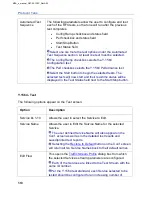
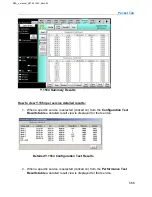
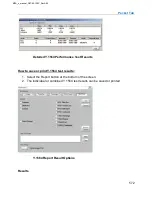
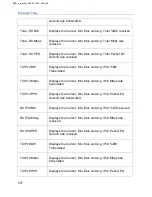
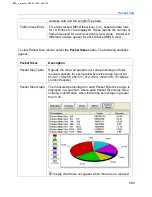
Results - Count Screen
(Specifically for LAN/WAN Ethernet testing on the Packet tab)
The Count screen displays
by type and count.
To view total transmit and receive utilization statistics, select the
Utilization
button. The
following statistics appear:
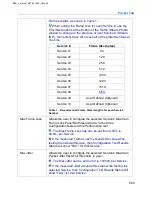
Desc column
Current / Min / Max / Avg columns
Total - TX BW
Displays the Current, Min, Max and Avg. Total %BW
Transmitted
Total - TX Mbps
Displays the Current, Min, Max and Avg. Total Mbps rate
transmitted
Total - TX PPS
Displays the Current, Min, Max and Avg. Total Packet Per
MPA_e_manual_D07-00-129P_RevA00
Summary of Contents for MPA
Page 2: ...MPA_e_manual_D07 00 129P_RevA00...
Page 10: ...MPA_e_manual_D07 00 129P_RevA00...
Page 82: ...MPA_e_manual_D07 00 129P_RevA00...
Page 110: ...MPA_e_manual_D07 00 129P_RevA00...
Page 134: ...MLD Tab 134 100G RS FEC Ethernet 400G RS FEC Ethernet MPA_e_manual_D07 00 129P_RevA00...
Page 255: ...Protocol Tabs 255 MPA_e_manual_D07 00 129P_RevA00...
Page 256: ...OTN Tab 256 MPA_e_manual_D07 00 129P_RevA00...
Page 748: ...MPA_e_manual_D07 00 129P_RevA00...
Page 796: ...MPA_e_manual_D07 00 129P_RevA00...


