Operator Interface
5.8.1.2
Y axis
The console contains information about units and limit values of the selected parameter. There are three methods to
set limit values:
Auto
the range of values is calculated automatically to fit entire values into the image;
Manual
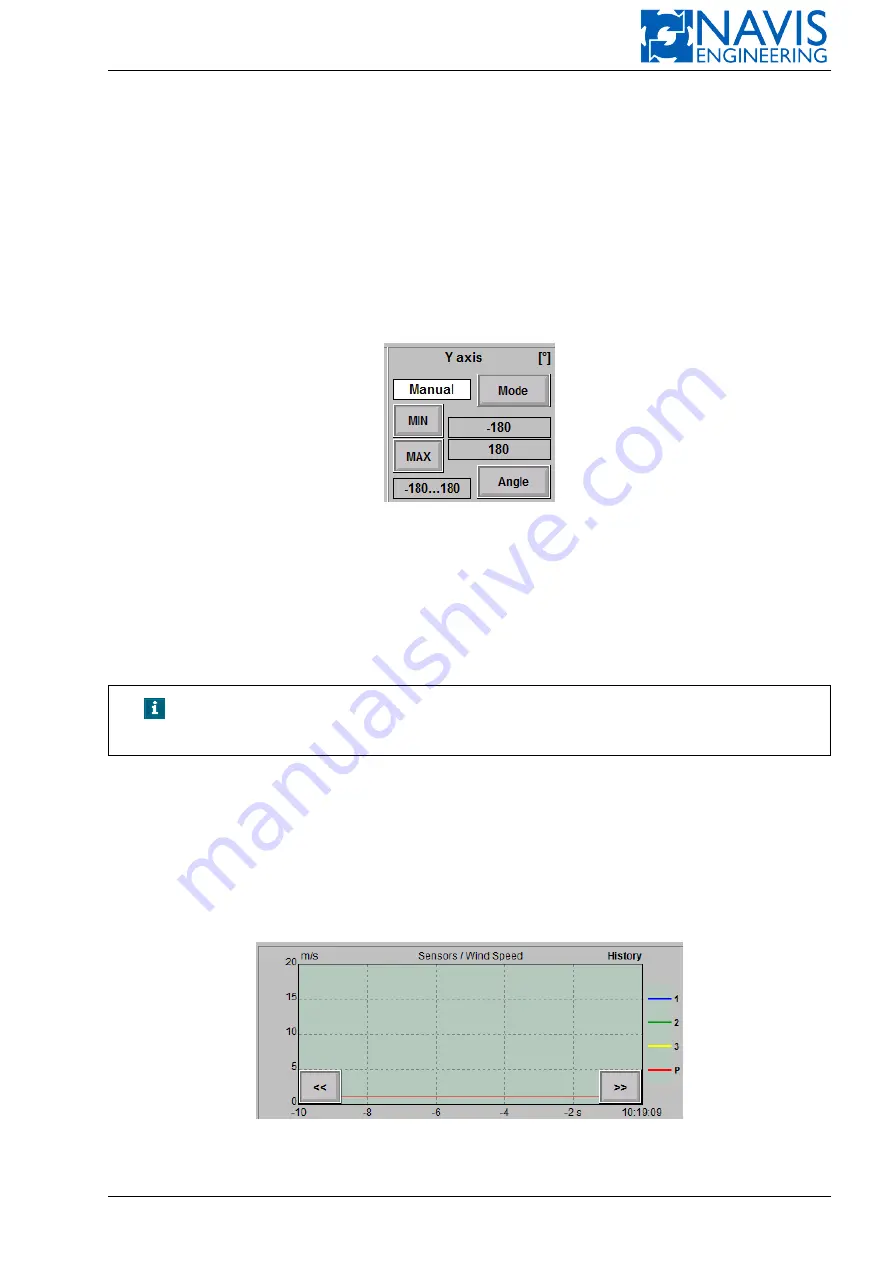
the range is fixed by operator; the operator is allowed to set the limits of Y axis values with the Min and Max
buttons; the buttons appear on the console just after the mode has been selected; the current values are displayed on
the right side of the proper button (see Figure 5.31);
Full Range
in this case the range is calculated automatically within minimum and maximum permissible values.
Figure 5.31: Y axis block
The method is selected by clicking the
Mode
button. It is possible to set a coordinate system for the parameters that
have a degree units. –180
∘
– 180
∘
and 0
∘
– 360
∘
are accessible by clicking the
Angle
button.
5.8.1.3
Time axis
There are two modes to display a trend: Actual and History.
NOTE!
All time settings are general for all trends. It means that whenever
changes occur, all trends apply them.
The initial(end-limit) time point is at the right bottom of diagram.
In case of Actual mode the end-limit value is the current time and the time interval gets back as negative values.
The units(hr, min,s)are displayed at the initial point.
The History mode allows selecting the end-limit point (the
End
button). In this case the static diagram is displayed
for the selected interval with the end-limit point. The units are displayed at the first interval value.
To switch to the graphic mode click
OK
. If the changes shouldn’t be applied click
Cancel
.
In case of the History mode the diagram can be moved along the time axis by clicking on the arrow buttons that appear
at the bottom right and bottom left after clicking on the proper background spots (see Figure 5.32).
Figure 5.32: History mode
Doc. 000.JDP-10000-OME, rev.3.3.13/“2102.$–17A-Advanced”
84


