NAVIS NavDP 4000. Operation Manual
8.8.1.1
Navigation bar
Navigation bar is used for changin displayed ref-systems set (
All
and
Used
), selection of Origin reference system
Origin
, view the parameters, graphs, and details for each ref-systems.
Up and down arrow softkeys allow to scroll a list of sensors, if required.
Use
All
,
Used
,
Details
,
View
/
Param
(available for the selected Ref-system) softkeys for switching a view of upper
window and
Plot
/
Graph
softkeys for switching a view of lower window.
8.8.1.2
Top sub-window
All
status — all Ref-systems are shown, which can be chosen or have already been chosen as Ref-systems. Ref-systems
data are shown in table.
In left column a softkey with indicators and raw data are shown.
The name of “Origin Reference” is shown at the top-left.
In right columns “BIAS”, “Noise” and “Weight” are presented.
Used
status — only used Ref-systems are shown.
Use the “Used” view as basic — at the same time all used Ref-systems are well shown and you can control status
of all of them.
Details
— press the softkey for displaying more detailed information concerning a Ref-system.
The following statuses are available for the selected Ref-system:
View
status — displays information for the selected Ref-system. View depends on the Ref-system type.
Param
status — allows changing parameters of the selected Ref-system.
8.8.1.3
Lower sub-window
Plot
Ship position estimated based on different Ref-systems is shown as “*” symbol. Color of symbol “*” is shown near
the Ref-system softkey.
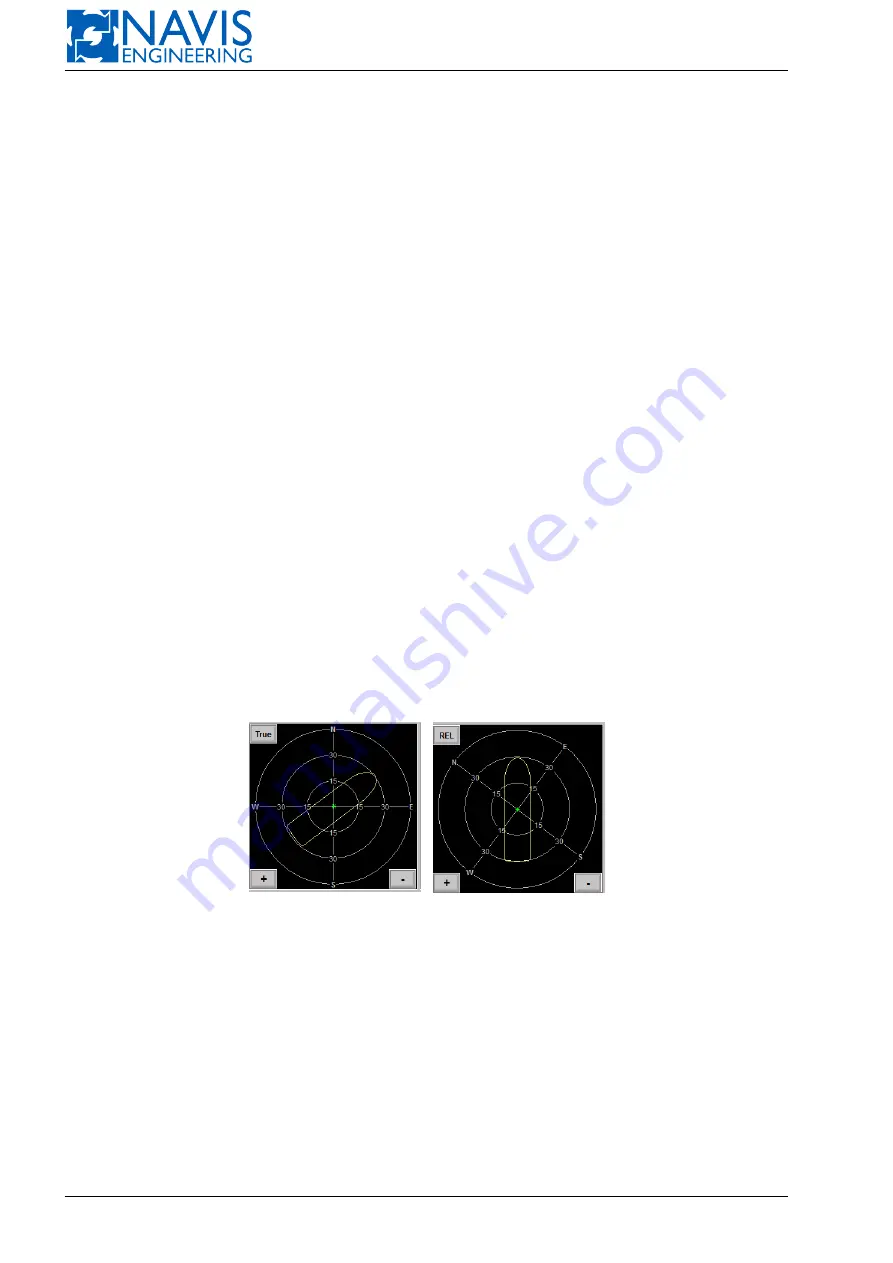
The Ref-system plot is shown in two views — TRUE and REL (see Figure 8.8). It’s scale can be changed with
softkeys “+” and “–” .
Figure 8.8: Ref-system Plot. True and relative views
On the right of the diagram the data processing results are shown (see Figure 8.9).
Clicking the backgound of Processing results switches the form of its presentation
filtration results the data displayed are changed (Lat/Lon/COG/SOG or X/Y/Vx/Vy).
General bias of position estimator is shown here and the “Remove BIAS” softkey is placed. See Section 8.8.3.1,
page 148 for details.
Settings for median test is configured by softkey “Reject”, “Low”, “High” parameters. See Section 8.8.3.2, page 149
for details.
Graph
In this mode graphs for all Ref-systems can be shown. An example of “Ref-system Graph” window is shown in
Figure 8.10. Configuring of graph (class, group, imems) — see Section 5.8, page 81.
The following Data Groups are available
145
Doc. 000.JDP-10000-OME, rev.3.3.13/“2102.$–17A-Advanced”


