NETAVIS Observer 4.6 User Manual (October 2015)
Page 166 of 204
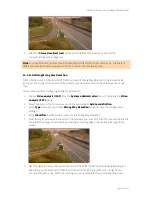
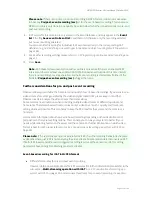
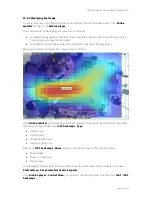
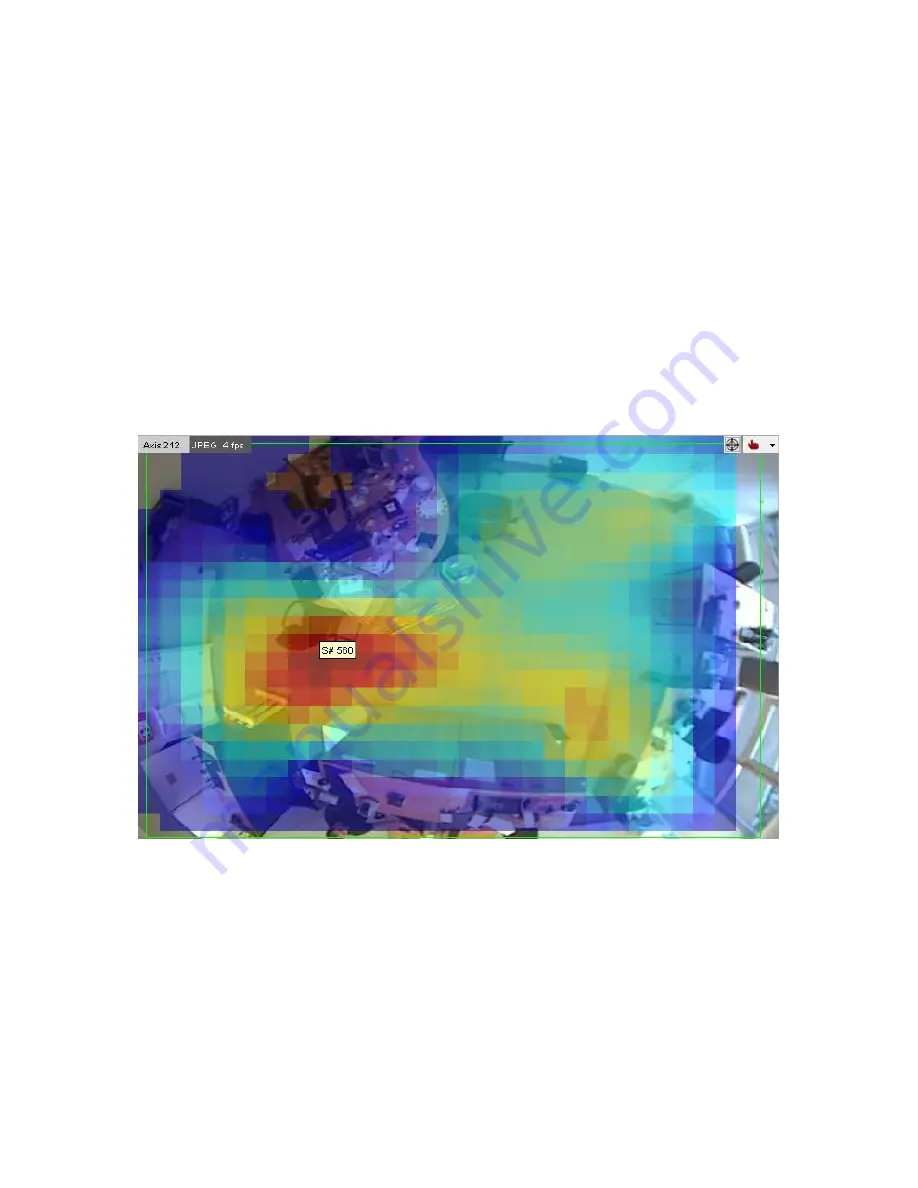
In the screenshot above you see an example of the object count heat map in an office situation. Cold
colors (such as blue) mean few object counts and hot colors (such as red) mean high object counts.
When you move the mouse over the view port you can see the raw heat map data for the
corresponding heat map type:
Object count: accumulated object count
Object speed: average speed of objects
Stopped object count: accumulated stopped object count
Object stopping time: accumulated stopped object time
In the screenshot above the count in the middle of the screen would be 3199 objects.
If you are normalizing the type of heat map (see
11.2 Setting Observer server parameters
on page 110
for further information) then the max value set there is displayed in brackets (3500 in the screenshot
above).
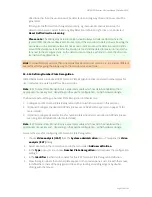
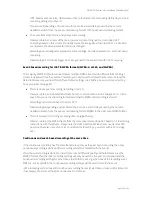
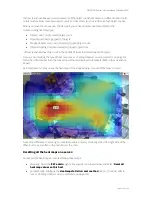
As a comparison, here you see the heat map of the stopped object counts of the same camera:
Notice the difference in coloring. You see that people only very seldomly stop in the right side of the
office but stop very often in the middle near the chair.
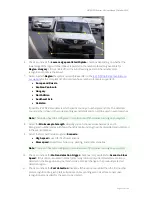
Resetting all the heat maps on a server:
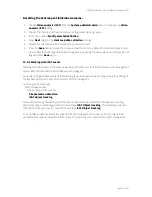
To reset all the heat maps on a server follow these steps:
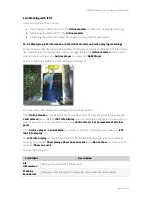
Manually: Open the
iCAT admin
, right-click anywhere on the window, and select
Reset all
heat map values on this host
.
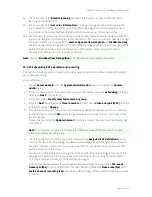
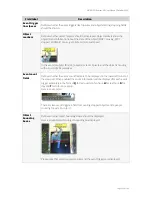
Automatically: Configure the
Heatmap statistics reset method
option in the Host Admin
(see
11.2 Setting Observer server parameters
on page 110).

