


Chapter 6: Using the Web Interface
313
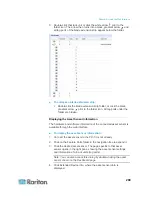
8. Enter or use the slide bar to set the number of images that can be
saved to the storage location.
9. Click OK.
Network Diagnostics
The PX provides the following tools in the web interface for diagnosing
potential networking issues.
Ping
Trace Route
List TCP Connections
Tip: These network diagnostic tools are also available through CLI. See
Network Troubleshooting
(on page 502).
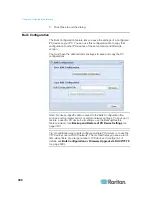
Pinging a Host
The Ping tool is useful for checking whether a host is accessible through
the network or Internet.
To ping a host:
1. Choose Maintenance > Network Diagnostics > Ping. The Ping
Network Host dialog appears.
2. In the Host Name field, type the name or IP address of the host that
you want to check.
3. In the Number of Requests field, type a number up to 20 or adjust
the value by clicking either arrow. This number determines how
many packets are sent for pinging the host.
4. Click Run Ping to start pinging the host. A dialog appears, displaying
the Ping results.
5. Click Close to quit the dialog.
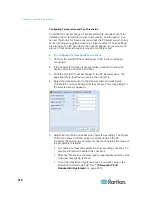
Tracing the Network Route
Trace Route lets you find out the route over the network between two
hosts or systems.
To trace the route for a host:
1. Choose Maintenance > Network Diagnostics > Trace Route. The
"Trace Route to Host" dialog appears.
2. Type the IP address or name of the host whose route you want to
check in the Host Name field.
Summary of Contents for PX3-4000 series
Page 5: ......
Page 627: ...Appendix I RADIUS Configuration Illustration 606 Note If your PX uses PAP then select PAP...
Page 632: ...Appendix I RADIUS Configuration Illustration 611 14 The new attribute is added Click OK...
Page 633: ...Appendix I RADIUS Configuration Illustration 612 15 Click Next to continue...
Page 648: ...Appendix J Integration 627 3 Click OK...
Page 661: ...Appendix J Integration 640 2 Launch dcTrack to import the spreadsheet file...


