100/180 mm PAPERLESS GRAPHIC RECORDER: USER GUIDE
HA028910
Issue 13 Sep 16
User Guide
Page 36
3.4 DISPLAY MODES (Cont.)
TIME CHANGE RECORDS
For vertical and horizontal trend modes a line is drawn across the width of the chart whenever a time
discontinuity in the record occurs. These lines disappear if a confi guration change which causes group
history to be lost, is made (such as adding a new channel to a group).
Red line
A red line is drawn on the trend history chart at power up.
Blue line
A blue line indicates that recording has been disabled/enabled in Group Confi guration
(
section 4.3.2
), or by a recording job (section 4.7.10). Blue lines are not drawn when the
Simulation Option
is active.
Green line
A green line appears if there has been a time change as a result of a clock job (
section
4.7.6
), an
SNTP synchronisation
or by the operator physically changing the recorder time.
Note: Changes from standard time to daylight saving time and back again are not ‘green lined’ in
this way
3.4.1 Vertical Trend display
This display (
fi gure 3.4.1b
) shows each point in the display group as though it were being traced on a
white chart. It is possible to change the appearance of the chart in the System key ‘Customise’ area of
confi guration (
section 4.6.10
). It is recommended that some thought be given to ensuring good contrast
between trace colours and background colour.
One of the channels is said to be the ‘current’ or ‘scale’ channel. This channel is identifi ed by its diamond
shaped pen icon and by its descriptor, digital value and scale being displayed on a ‘faceplate’ across the
full width of the screen, above the chart. If a channel is included in the display group but its status is ‘not
good’ for some reason, then its pen icon is hollow.
Faceplates for all the group channels can be displayed, by using the Faceplates On/Off key in the option
menu. If selected On, faceplates (showing colour, descriptor, digital value and units) for all the group’s
channels appear either above the current channel’s faceplate or, if there are too many to fi t across the
screen, at the right hand edge of the screen. When necessary, a slider bar appears to allow further (hid-
den) faceplates to be viewed.
Each channel in the display group becomes the ‘current’ channel, in turn, for approximately 10 seconds
– i.e. the channels are cycled-through, starting with the lowest numbered channel. Once the fi nal chan-
nel in the group has been displayed for 10 seconds, the lowest numbered channel is returned to and the
sequence repeats. This scrolling process can be enabled or disabled using the Channel Cycling On (Off)
key in the Option menu.
To select a particular channel to be the current channel, the relevant pen icon can be touched. To cycle
through the channels manually, the faceplate area is touched repeatedly until the required channel is
reached.
The
Horizontal Trend display
can be called using the down arrow key. Alternatively, any one of the ena-
bled display modes (
section 4.3.4
) can be selected using the
Root Menu
, ‘Goto View’ key.
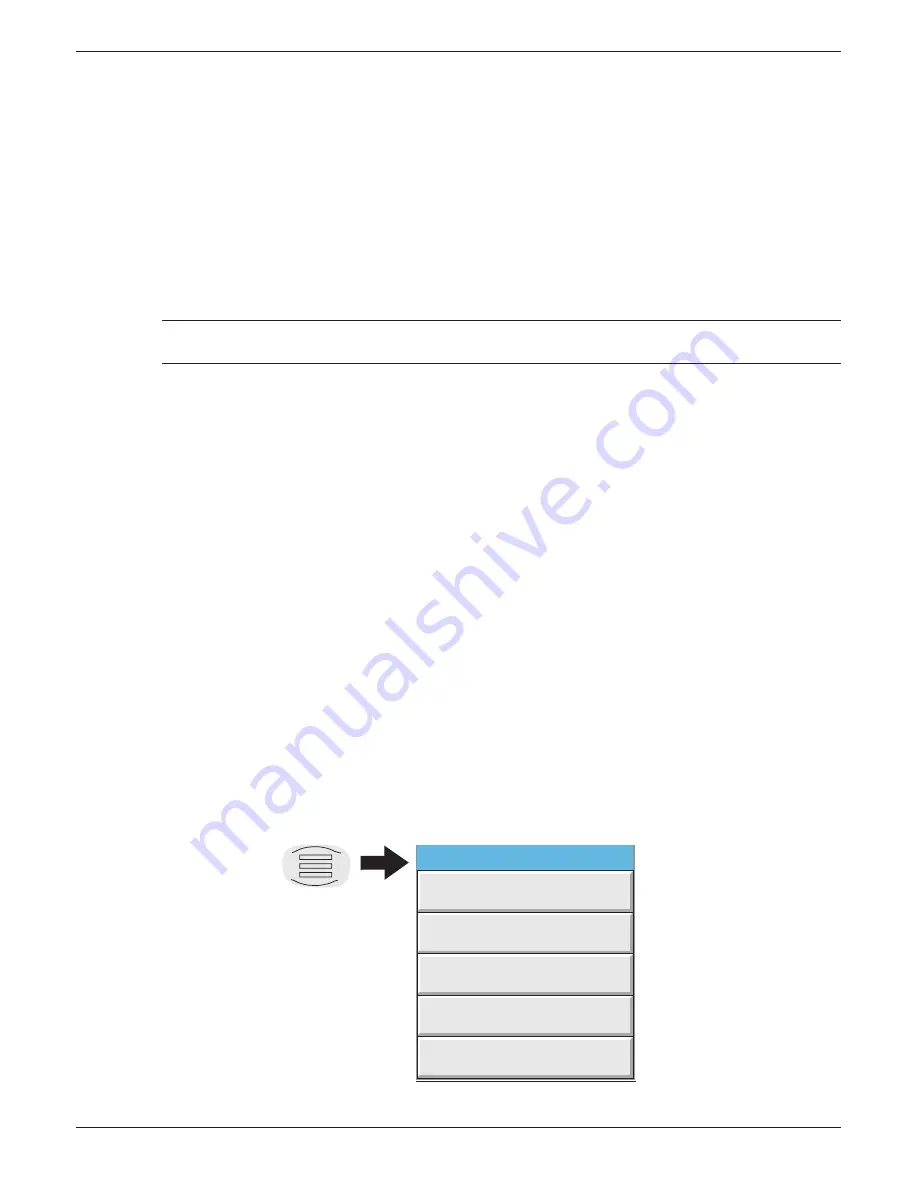
Figure 3.4.1a Option Menu (Typical)
Option
K ey
Option Menu
Enter History
Channel Cycling Off
Faceplates On/Off
Batch
Note


