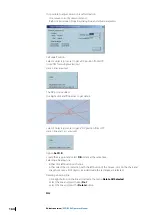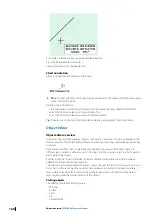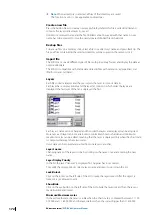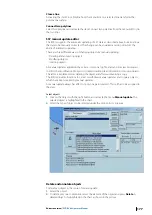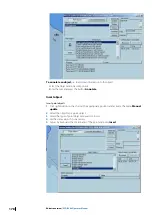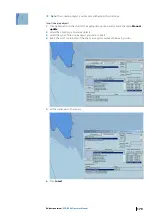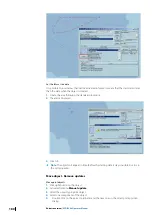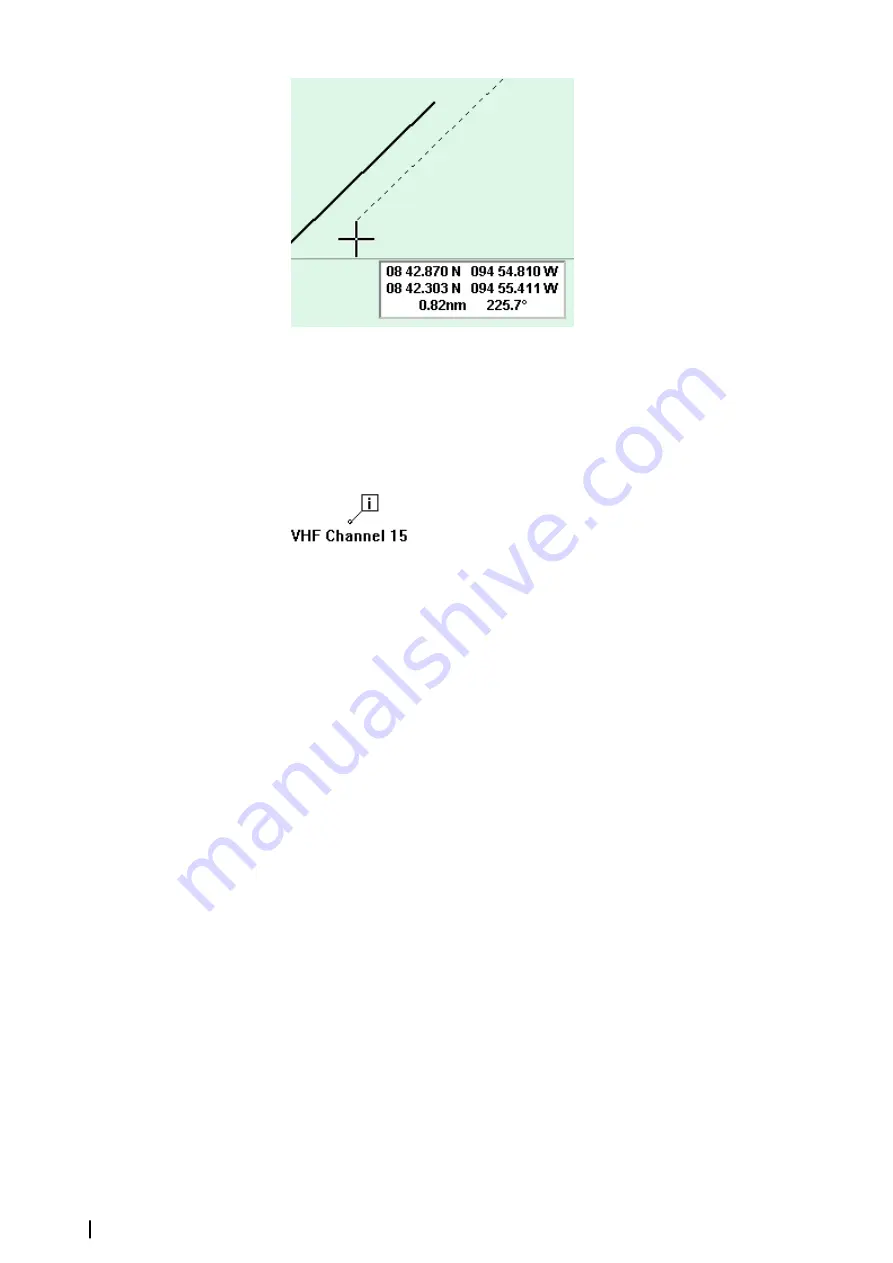
To modify or delete the line see paragraph Bearing line.
Press the Perpendicular line button
Same procedure as for the parallel line.
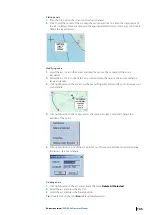
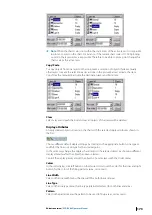
Chart annotation
Allow inserting text annotations on the chart.
Ú
Note:
to show the text on the chart toggle on the button Display in the Properties dialog
of the Information point.
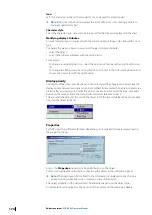
Deleting Chart Annotation
•
Click right button on the Chart Annotation and activate the menu Delete All Selected.
•
Select the Chart Annotation and press the key Del.
•
Select the Chart Annotation and press the Delete button .
Tip:
Double click on the tool Chart Annotation deletes all displayed Chart Annotations.
Object Editor
Object editor overview
User data consists of geographical objects such points, lines, areas, that are displayed on the
chart to enrich it. The Object Editor (OE) allows plotting, importing, manipulating and saving
user data.
Data are saved in files that can be loaded or unloaded on request. Each files contains 8
different layers called by default Layer 0,1,2,3,4,5,6,7 and the user can select in which layer he
wants data to be stored.
Each layer may be shown or hidden, locked or unlocked and defined as visible between
editable minimum and maximum scales.
This feature is extremely powerful because it gives the user the tools to build up its own user
data charts in the same way than vector chart databases are built. For instance, a general
layer, visible in small scales, could include synthetic description of objects while a harbor
layer could contain the full description of the objects.
Plotting objects
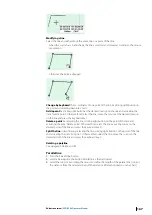
The different available object types are:
•
Polyline
•
Surface
•
Circle
•
Arc
•
Isolated point
168
Editors overview
| ECDIS900 Operator Manual

