APPLIED OPERATIONS
/Changing the Image Display Method
IV.
OPERATION INSTRUCTIONS
IV .
2 - 2 0 3
Page
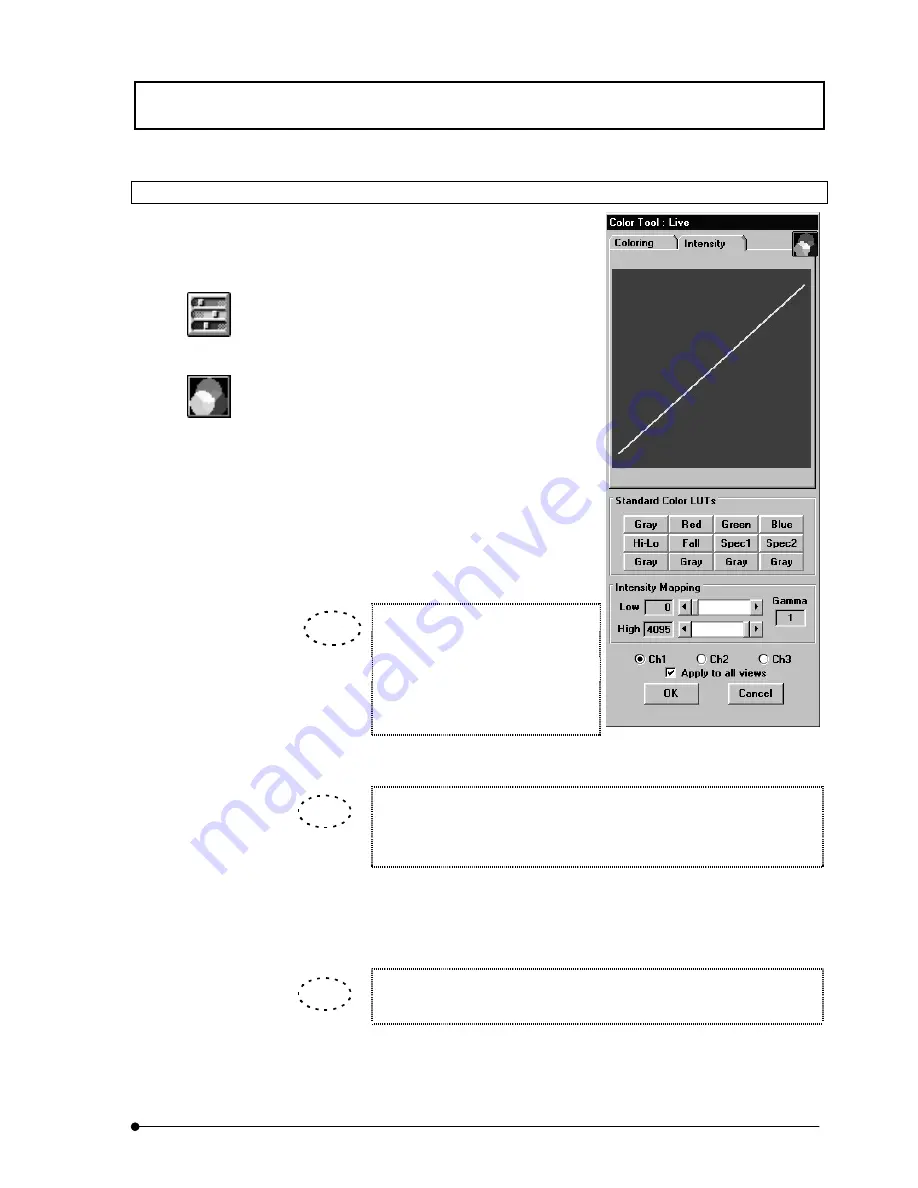
2-5-2-2 LUT Graph Editing by Gamma Correction
The intensity data of an image can be reallocated
to make it easier to view.
1. Display the [Display] panel of the image to be
subjected to LUT change.
2. Click the <LUT> button in the toolbar at the
bottom left of the screen.
3. Click the <Graph display> button on the top
right of the [Color Tool] dialog box, then
select the [Intensity] sub-panel. The intensity
graph of the LUT appears in the [Color Tool]
dialog box.
4. Set the range of intensity graph application
using the [Low] and [High] scales in the
[Intensity Mapping] group box.
Dragging one end of the graph
makes it possible to change the
inclination. The set intensity graph is
immediately reflected in the image in
the [Display] panel.
When the [Low] scale, [High] scale and [Gamma] text box are double-
clicked, they are reset to the default values(“0” with the [Low] scale, “4095”
or “255” with the [High] scale and “1.0” with the [Gamma] text box).
5. The gamma value can be changed by dragging on the graph. The set intensity
graph is immediately reflected in the image in the [Display] panel.
The gamma value can also be changed by entering a gamma value in the
[Gamma] text box in the [Intensity Mapping] group box.
6. If it is required to save the edited LUT in a file, click the <Save LUT> button in the
[Color LUT Tool] group box.
Fig. 2-66 LUT Intensity Graph
Display
<LUT> button
<Graph display> button
TIP
TIP
TIP
Summary of Contents for FLUOVIEW FV300
Page 2: ......
Page 8: ......
Page 10: ......
Page 12: ......
Page 26: ......
Page 28: ......
Page 38: ......
Page 114: ......
Page 486: ......
Page 506: ......
Page 512: ......
Page 518: ......
Page 520: ......
Page 548: ......
Page 552: ......
Page 554: ......
Page 556: ......
Page 562: ......
Page 563: ......


