


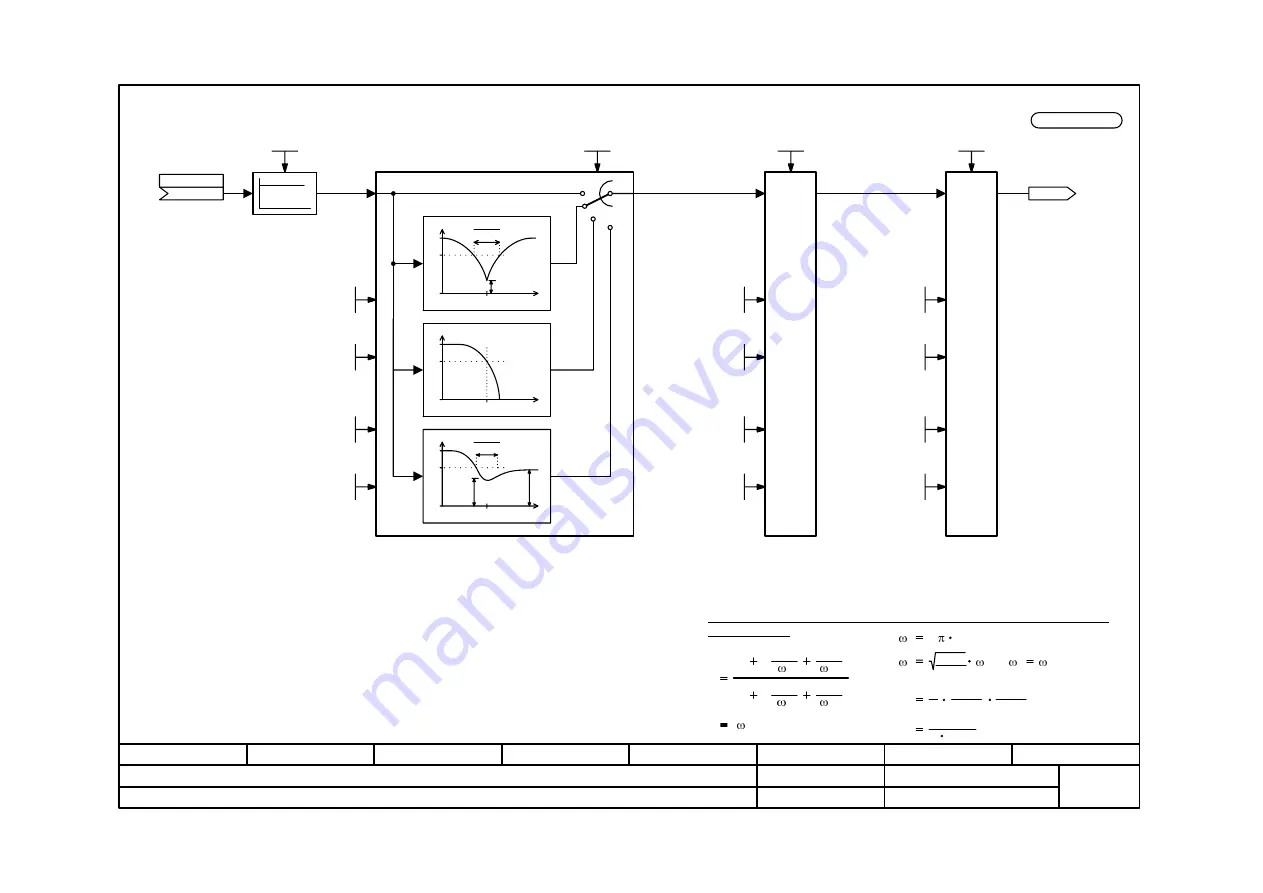
Function diagram
8
7
6
5
4
3
2
1
fp_mc_361_e.vsd
Speed filter
MASTERDRIVES MC
03.03.08
- 361 -
V2.5
Filter 1
Filter 3
Filter 2
as F
ilter 1
Please keep in mind that the resolution of the output variable diminishes as a smaller and
smaller filter frequency (P254) is selected.
This effect does not disturb as much if the filters are connected
- to the system deviation of the speed controller at P238 = 0 (PI controller)
(P252 = KK0152, P228 = KK0158)
- or to the output of the speed controller at P238 = 1 (reference model)
(P252 = K0153 , P260 = KK0158).
In addition, the calculation sequence must be adapted in both cases
(e.g. U963.42 = 5, U963.43 = 2, U963.45 = 3).
Only values in the range of 0 to 20 may be entered in U953.41...45.
as F
ilter 1
f
1
.7
0
P254
P253
P254
P257
f
1
.7
0
P254
2
1
0
f
1
.7
0
P254
P254
P257
P258
P253
3
The diagrams show examples of typical filter amplitude responses. The exact
bode diagram depends on the choosen parameters.
Transfer function for filter with 2nd order numerator denominator polynomial
for P256 = 1/3 :
2 d
N
Z
2
N
2
Z
N
2 d
Z
s
2
s
1
s
2
s
1
F
Z
2
P254
N
Z
d
Z
1
2
d
N
1
P253
2
j
s
N
Z
,
for P256 = 1
,
KK
P252 (0)
Src Band-Stop
Band-Stop Gain
0.0 ... 150.0 %
P251 (100.0)
U953.42 = ___(0)
Filter character
0 .. 3
P256.1 (1)
Qty Band-Stop
0.0 ... 3.0
P253.1 (0.0)
Filter frequency
1.0 ... 500.0
P254.1 (50.0)
KK0158
n(Band-Stop)
Qty Band-Stop
0.0 ... 3.0
P253.3 (0.0)
Filter frequency
1.0 ... 500.0
P254.3 (50.0)
Qty Band-Stop
0.0 ... 3.0
P253.2 (0.0)
Filter frequency
1.0 ... 500.0
P254.2 (50.0)
Filter character
0 .. 3
P256.2 (0)
Filter character
0 .. 3
P256.3 (0)
Filter adaptation 1
0.000 ... 100.000 %
P257.1 (0.000)
Filter adaptation 2
0.000 ... 100.000 %
P258.1 (100.000 %)
Filter adaptation 1
0.000 ... 100.000 %
P257.2 (0.000)
Filter adaptation 2
0.000 ... 100.000 %
P258.2 (100.000 %)
Filter adaptation 1
0.000 ... 100.000 %
P257.3 (0.000)
Filter adaptation 2
0.000 ... 100.000 %
P258.3 (100.000 %)
P258
100%
1
P253
P257
100%