


The Spectrum Application
R&S
®
FPC
90
User Manual 1178.4130.02 ─ 07
The best way to display a spectrogram is therefore to reduce the level range until
the lowest signal part is mapped to the lower end of the color map and the highest
signal part to the upper end of the color map.
Note
: You can also use the "Auto Range" menu item to adjust the displayed level
range. In that case, the R&S
FPC selects a level range that best suits the currently
measured signal.
In a last step, you can configure the spectrogram in a way that it only shows signal
peaks in color and the noise floor in black. To get a result like that you have to
reduce the level range, until the noise floor is outside the displayed range.
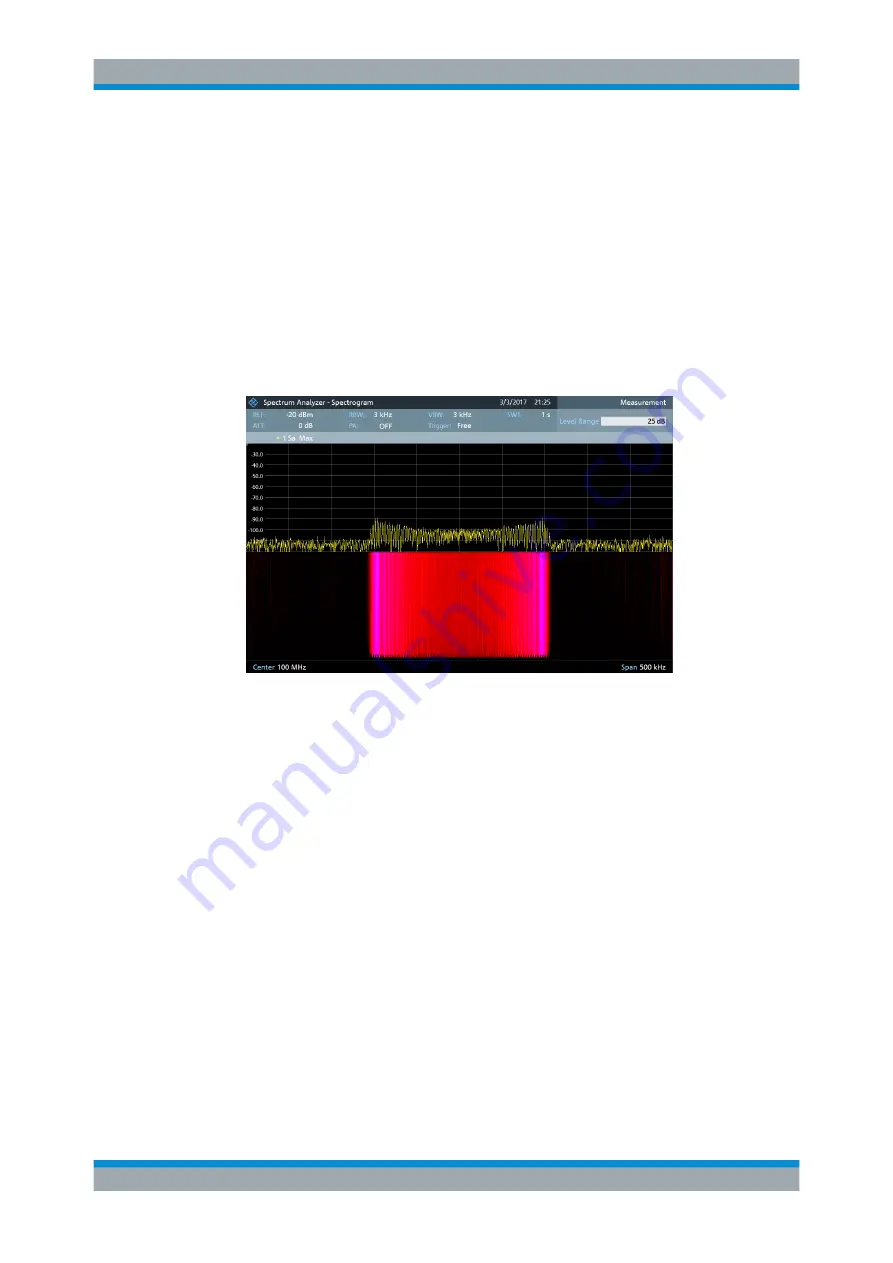
7. Instead of entering a level range of 40
dB, enter a level range of 30
dB or even
25
dB.
This provides a high contrast between signal parts that are above the noise floor,
and the noise floor, which is drawn in black.
To show details of the noise floor, and exclude the peak levels you have to lower
the spectrogram reference level, until it is just above the noise floor.
The R&S
FPC then displays the signal parts that are above the reference level in
only one color, which is the color at the upper border of the color map.
14.2.7.3
Spectrogram Playback
Saving spectrogram data
You can save the data of the spectrogram for documentation or for further analysis of
the recorded data.
1. Press the "Meas" key to open the measurement menu.
2. Select the "Save" menu item to open the file manager.
3. Enter the name of the spectrogram with the alphanumeric keys.
By default, the R&S
FPC saves the spectrogram as
Spectrogram###
with
ascending numbers. The file extension for spectrogram data is
*.spm
.
Measurements and Result Displays


