


Brocade Network Advisor SAN User Manual
177
53-1003154-01
Dashboard customization
6
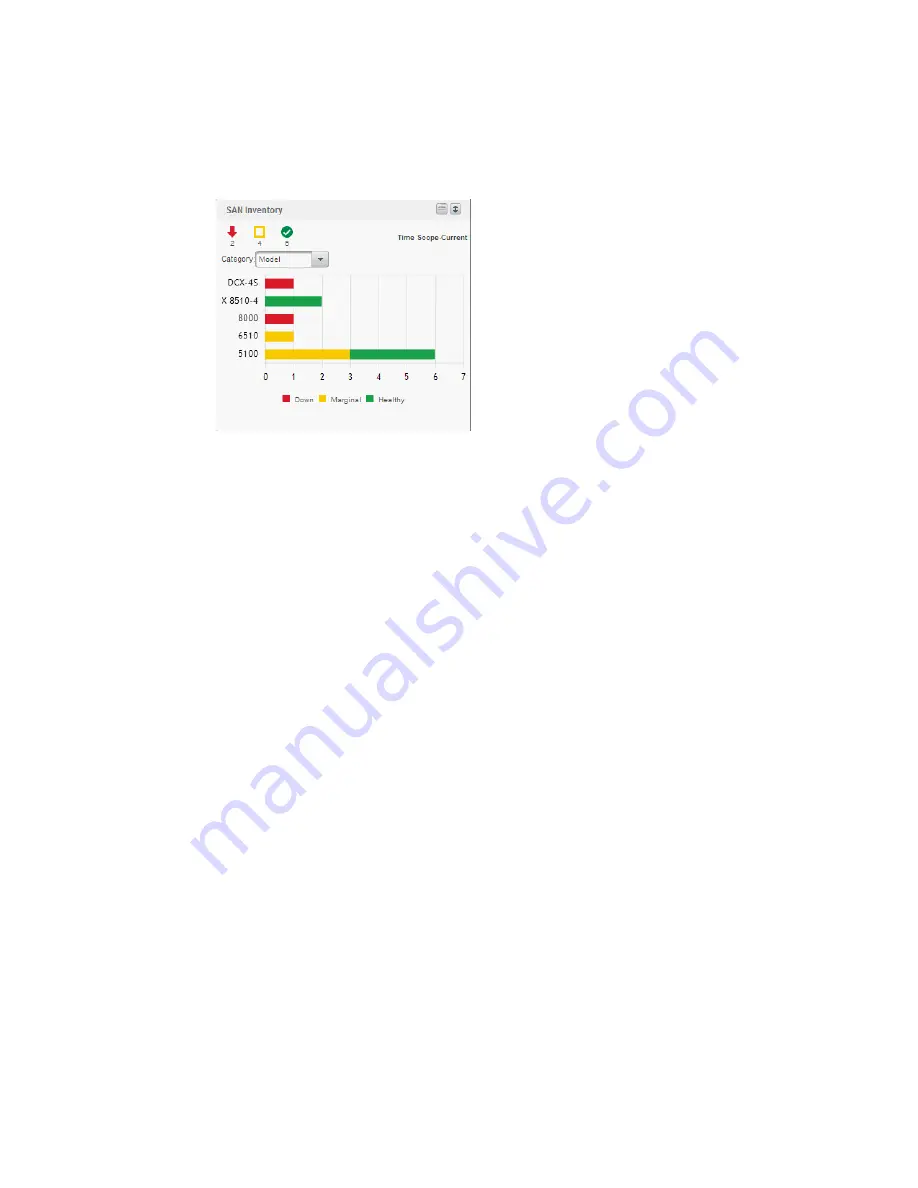
SAN Inventory widget
The SAN Inventory widget (
Figure 59
) displays the SAN products inventory as stacked bar graphs.
FIGURE 59
SAN Inventory widget
The SAN Inventory widget includes the following data:
•
Widget title — The name of the widget.
•
Show Legend icon — Click to display the color legend for the widget below the bar chart.
•
Widget summary — The product count for each status (worst to best order) with the associated
icon displays underneath the widget title.
•
Time scope — The time scope.
•
Category list — Use to customize this widget to display a specific group of products. Options
include: Firmware, Model, Location, and Contact.
•
Bar chart — The product status as a percentage of the total number of products.
The bar chart displays each group as a separate bar on the graph. Displays the current state of
all products discovered for a group in various colors on each bar. Tooltips showing the number
of devices in that state are shown when you pause on the bar. Double-click a bar in the graph
to navigate to the SAN Inventory Detailed View page. For more information, refer to
“Viewing
additional SAN product data”
on page 178.
Color legend — Displays the color legend below the bar chart. Click the Show Legend icon to
display.
-
Green — Healthy: Status obtained from the SAN switch based on Fabric Watch or
Monitoring and Alerting Policy Suite (MAPS) thresholds configured on the switch.
-
Yellow — Marginal: Status obtained from the SAN switch based on Fabric Watch or MAPS
thresholds configured on the switch.
-
Red — Down: Status obtained from the SAN switch based on Fabric Watch or MAPS
thresholds configured on the switch.
-
Blue — Not Reachable: SAN switch is not reachable by HTTP.
-
Gray — Unknown: Temporary status that displays when switch asset collection is in
progress. Once switch asset collection is complete, the current status is obtained from the
switch.
Summary of Contents for Network Advisor 12.3.0
Page 4: ...iv Brocade Network Advisor SAN User Manual 53 1003154 01...
Page 86: ...34 Brocade Network Advisor SAN User Manual 53 1003154 01 Uninstalling a patch 2...
Page 190: ...138 Brocade Network Advisor SAN User Manual 53 1003154 01 Fabric tracking 4...
Page 216: ...164 Brocade Network Advisor SAN User Manual 53 1003154 01 User profiles 5...
Page 612: ...560 Brocade Network Advisor SAN User Manual 53 1003154 01 Exporting Host port mapping 13...
Page 620: ...568 Brocade Network Advisor SAN User Manual 53 1003154 01 Exporting storage port mapping 14...
Page 720: ...668 Brocade Network Advisor SAN User Manual 53 1003154 01 Security configuration deployment 17...
Page 744: ...692 Brocade Network Advisor SAN User Manual 53 1003154 01 Configuring Virtual Fabrics 19...
Page 1068: ...1016 Brocade Network Advisor SAN User Manual 53 1003154 01 Removing thresholds 24...
Page 1098: ...1046 Brocade Network Advisor SAN User Manual 53 1003154 01 Swapping blades 25...
Page 1176: ...1124 Brocade Network Advisor SAN User Manual 53 1003154 01 SAN connection utilization 28...
Page 1378: ...1326 Brocade Network Advisor SAN User Manual 53 1003154 01 Event logs 32...
Page 1448: ...1396 Brocade Network Advisor SAN User Manual 53 1003154 01 Upload failure data capture 34...
Page 1490: ...1438 Brocade Network Advisor SAN User Manual 53 1003154 01 SAN shortcut menus A...
Page 1494: ...1442 Brocade Network Advisor SAN User Manual 53 1003154 01 Call Home Event Tables B...
Page 1524: ...1472 Brocade Network Advisor SAN User Manual 53 1003154 01 About Roles and Access Levels D...
Page 1552: ...1500 Brocade Network Advisor SAN User Manual 53 1003154 01 Regular Expressions F...
Page 1920: ...1868 Brocade Network Advisor SAN User Manual 53 1003154 01 Views H...


