6135A/PMU
Operators Manual
7-4
Graph Configuration Window
To make and configure an interactive graph, use the graph configuration window (see
Table 7-1). The graph configuration window automatically opens after the test data is
collected and analyzed after a test is run.
To understand how to configure the panels and windows, use simulation mode and
experiment with different configurations. The window titles on the interactive graph
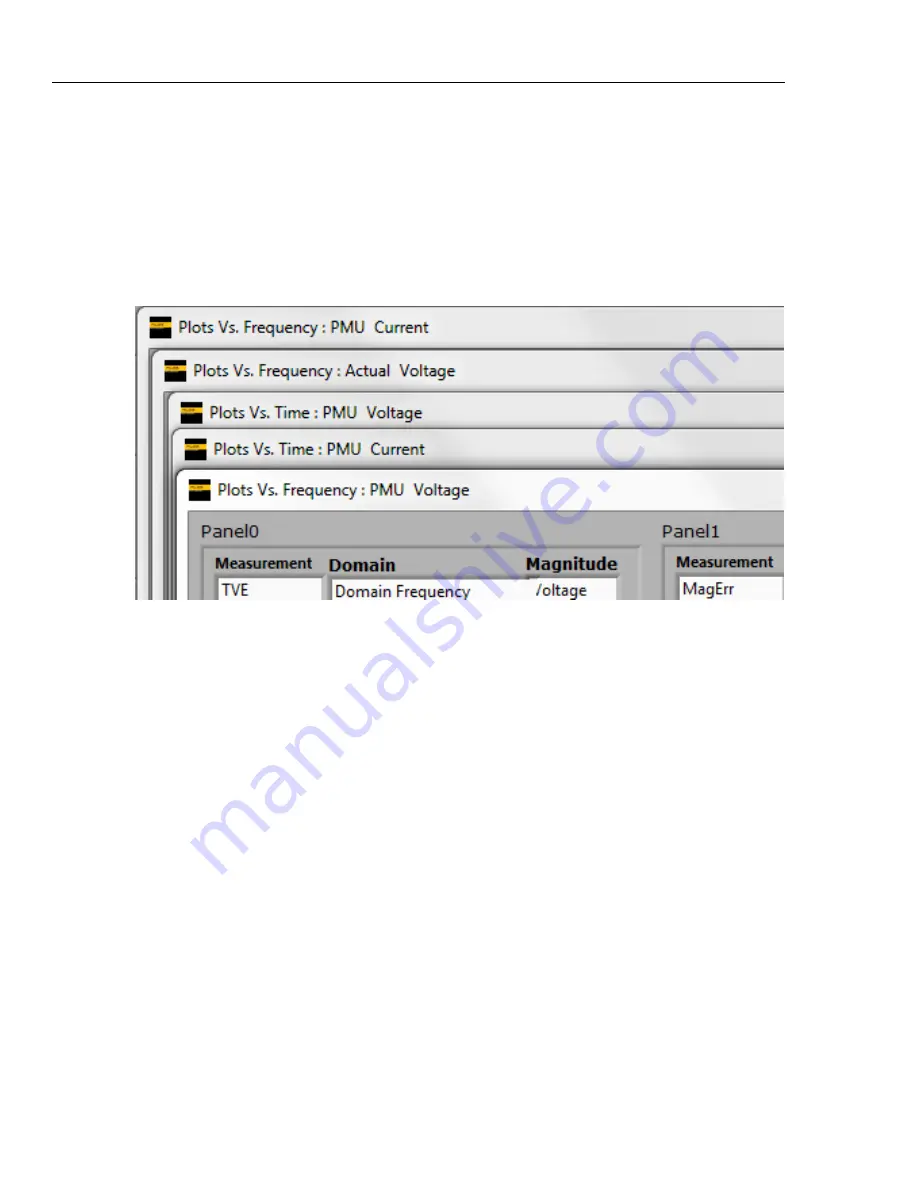
windows show what test information the panels in the window contain (see Figure 7-2).
Refer to the example configurations in this section to visually see the relationship
between the configuration selections and the interactive graph windows.
gtu095.jpg
Figure 7-2. Interactive Graph Window Title Information
Make an Interactive Graph
To make an interactive graph:
1.
Run or simulate an interactive test (refer to “Run a Single Test” or “Run a Custom
Interactive Test” in Chapter 6).
2.
Configure the interactive graph with the interactive graph configuration window
(refer to Table 7-1 and the examples in this section).
3.
Customize the view as desired (refer to “Change the View of an Interactive Graph” in
this chapter).
Содержание 6135A/PMU
Страница 28: ...6135A PMU Operators Manual 2 2...
Страница 44: ...6135A PMU Operators Manual 3 2...
Страница 70: ...6135A PMU Operators Manual 3 28...
Страница 72: ...6135A PMU Operators Manual 4 2...
Страница 92: ...6135A PMU Operators Manual 4 22 gtu135 jpg Figure 4 12 Problem All Outputs Forced Off...
Страница 94: ...6135A PMU Operators Manual 5 2...
Страница 102: ...6135A PMU Operators Manual 5 10...
Страница 104: ...6135A PMU Operators Manual 6 2...
Страница 120: ...6135A PMU Operators Manual 7 2...
Страница 138: ...6135A PMU Operators Manual 7 20 gtu120 emf Figure 7 18 Example Report...
Страница 140: ...6135A PMU Operators Manual 8 2...
Страница 150: ...6135A PMU Operators Manual 9 2...
Страница 160: ...6135A PMU Operators Manual A 4...


