BCD
0000 to 9999
BCD 16 bit format
5. The
Int. Number
and
Dec. Number
attribute boxes are used to specify the number of digits you want
displayed before/after a decimal point. For example, suppose you are monitoring a 16-bit PLC register
using unsigned format with Min = 0 and Max =1000. The value in the PLC register is 500. If Int.
Number =2 and Dec. Number =1, then the BLU300 displays this number as 50.0 (with the needle
pointed halfway).
6. The
Max
attribute specifies the
maximum value
that causes the analog meter needle to point to at the
maximum value. The
Min
attribute box allows you to set the
minimum value,
which causes the analog
meter needle to point to the minimum value on the meter.
7. The
Style
determines whether the meter format if a
full circle
(360) or
semi-full circle
(330).
8. The
Font Size
for the scale numbers depicted on the meter can be 5x8 (width/height), 8x8, 8x12, or
8x16 pixels for each character.
9. The
Major Ticks
determines the major markers that show scaled numbers. The minimum required is
2.
10. The
Minor Ticks
determine the number of subdivisions between each major marker. The minimum
number allowed is 0.
11. Click
OK
. The Analog Meter is displayed on the main screen of BlueLeaf. If necessary, use the
mouse to drag the object to the location on the screen that you want it. You can also highlight the
object to display the small white perimeter boxes and adjust the size. Simply move the mouse cursor
over the appropriate white box until the mouse cursor changes to a double-arrow symbol, then click
and drag to change the size.
Creating Trend Displays
The Trend Display Object can be used to display data from consecutive 16-bit PLC registers as a trend graph along an XY
axis. The Y axis represents the range of values for the set of PLC registers plotted along the vertical graph. The X axis
represents the total number of points (PLC registers) that will be plotted.
4
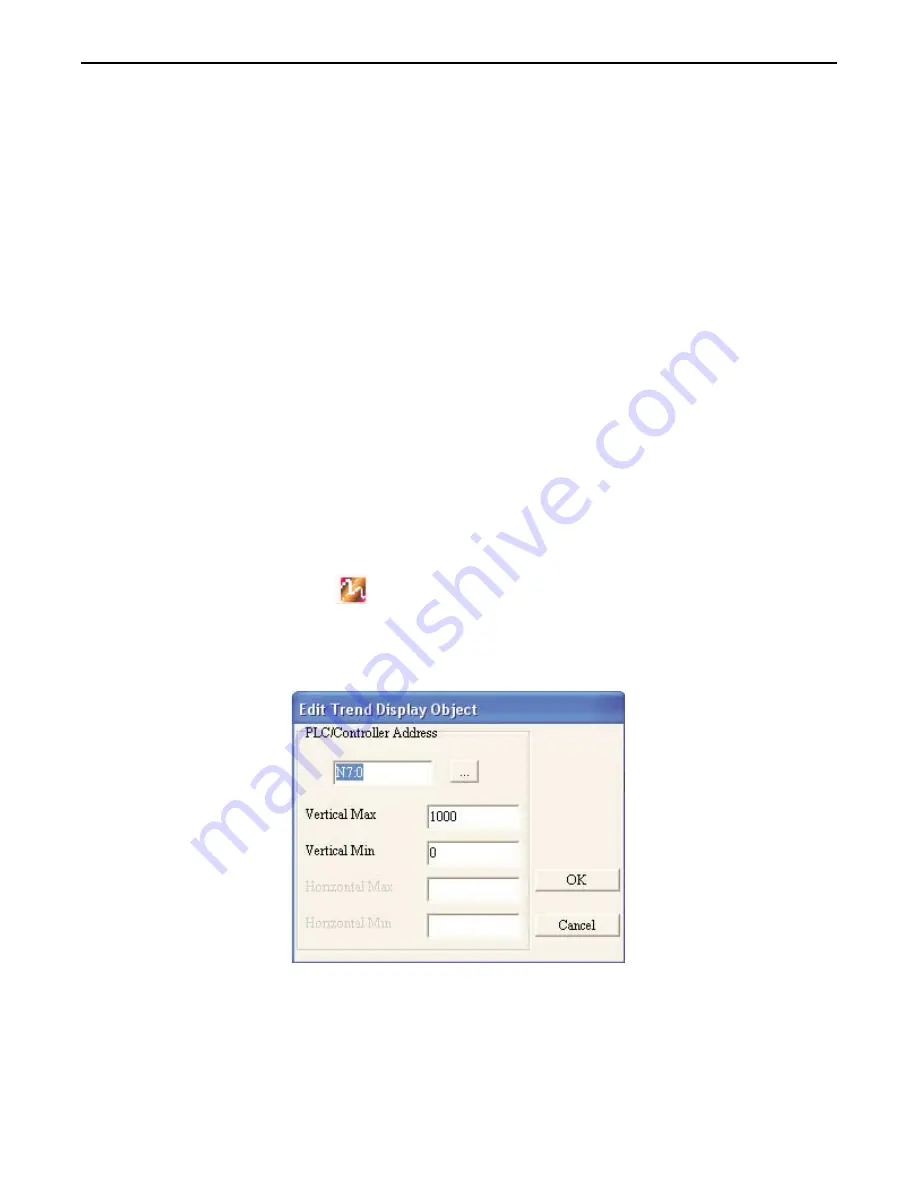
To create a Trend Display Object
1. From the Objects menu, click
Trend Display
, or click the Trend Display icon on the objects toolbar.
The mouse cursor will change to a crosshair. Select the location on the screen to place the Trend
Display and left click the mouse to place the Trend Display object on the screen. Move the mouse
cursor over the Trend Display object, and double click the Trend Display. The Edit Trend Display
dialog appears.
1010-0300, Rev 02
Bar Graphs and Meters
117


