4. In the
Format
attribute box, select the format type you wish to use. The options are:
Format
Range
Size
(Bits)
Description
Unsigned
0 to 65535
16
unsigned 16 bit format
0 to 4294967295
32
unsigned 32 bit format
Signed
-
32768 to +32767
16
signed 16 bit format
-2147483648 to +2147483647
32
signed 32 bit format
Hexadecimal
0000 to FFFF
16
hexadecimal 16 bit format
00000000 to FFFFFFFF
32
hexadecimal 32 bit format
BCD
0000 to 9999
16
BCD 16 bit format
00000000 to 99999999
32
BCD 32 bit format
5. In the
Size
attribute box, select either
16
bits or
32
bits.
6. In the
Direction
attribute box, select how you wish to align the data that is displayed- Bottom to Top,
Top to Bottom, Right to Left, and Left to Right.
7. The
Max
attribute specifies the
maximum value
, which causes the bar graph to be completely filled.
The
Min
attribute box allows you to set the
minimum value,
which equates to an empty bar graph.
8. Click
OK
. The Bar Graph is displayed on the main screen of BlueLeaf. If necessary, use the mouse to
drag the object to the location on the screen that you want it. You can also highlight the object to
display the small white perimeter boxes and adjust the size. Simply move the mouse cursor over the
appropriate white box until the mouse cursor changes to a double-arrow symbol, then click and drag to
change the size.
Creating Analog Meters
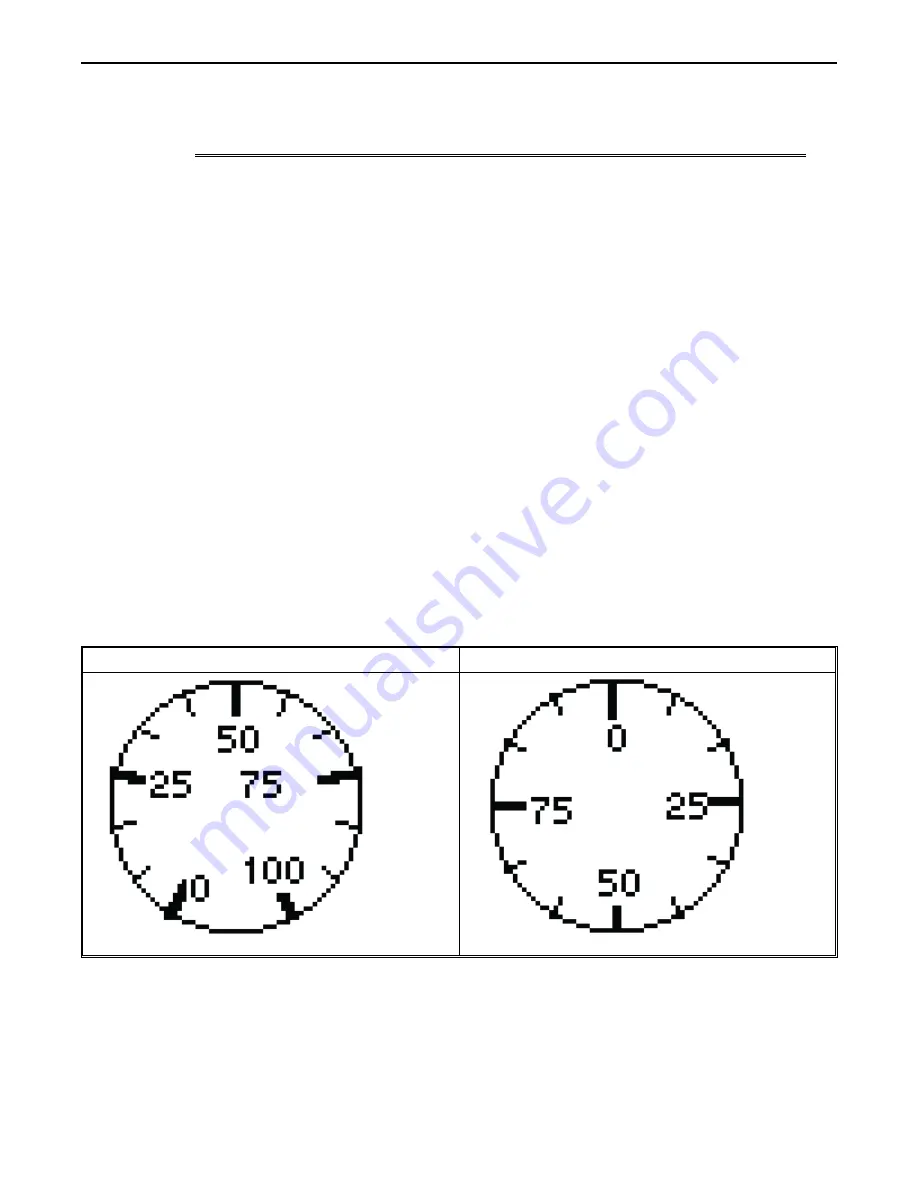
The Analog Meter Object is used to represent the data in a 16-bit PLC register as a scaled meter. You can configure the
Display Meter in two styles:
300 degrees
360 degrees
Data in the PLC register can be interpreted as unsigned, signed, BCD, or hexadecimal. You can select the minimum and
maximum range displayed, then select the number of major delineations (tick marks) as well as minor delineations (minor
tick marks).
1010-0300, Rev 02
Bar Graphs and Meters
115


