122 | Discovering, Adding, and Managing Devices
Dell PowerConnect W-AirWave 7.6 | User Guide
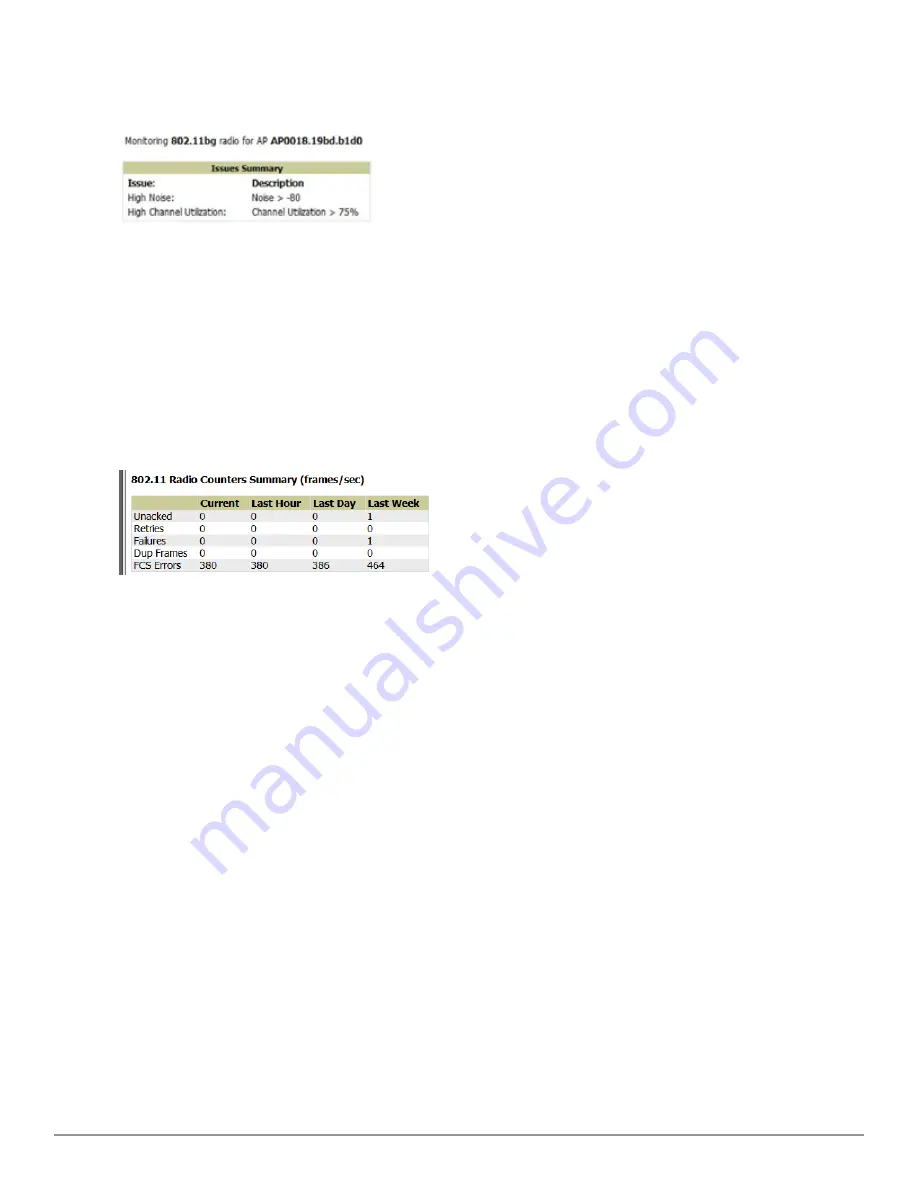
Figure 83:
Issues Summary
Section Illustration
These issues highlighted in this section can be examined in detail using the corresponding interactive graphs on the
same page. See the
"Radio Statistics Interactive Graphs" on page 122
section of this chapter for details.
802.11 Radio Counters Summary
This table appears for radios with 802.11 counters and summarizes the number of times an expected
acknowledgement frame was not received, the number of duplicate frames, the number of frames containing Frame
Check Sequence (FCS) errors, and the number of frame/packet transmission retries and failures. These aggregate error
counts are broken down by Current, Last Hour, Last Day, and Last Week time frames, as illustrated in
Figure 84
.
Figure 84:
802.11 Radio Counters Summary
table
The frame- per-second rate of these and other 802.11 errors over time are tracked and compared in the
802.11
Counters
graph on the same page.
Radio Statistics Interactive Graphs
Time-series graphs for the radio are displayed across a tabbed, dual-pane interface to show changes recorded at every
polling interval over time. Clients and Usage data are polled based on the AP's group's
User Data Polling Period
.
Channel, Noise, and Power are based on
AP Interface Polling Period
. 802.11 Counters data are based on the APs
group’s
802.11 Counters Polling Period
.
You can adjust the attributes of these graphs as follows:
l
Drag the horizontal slider under the graphs to move the scope of all graphs between one year ago and the current
time.
l
Drag the vertical slider between graphs to change the relative width of each.
l
The
Show All
link displays all of the available data series.
l
The bar-graph icon on the upper right-hand corner of each graph opens a new window and displays all data series
for the selected graph over the last two hours, last day, last week, last month, and last year in one page. The
graphs that display depend on the AP and/or its controller.
l
Select the checkbox next to any metric to remove its data from the graph. Select
Collapse
to remove unchecked
metrics from the legend, and
Show All
to restore them.
The two graph panes enable simultaneous display of two different information sets, as detailed in the following table:
Summary of Contents for PowerConnect W-AirWave 7.6
Page 1: ...Dell PowerConnect W AirWave 7 6 User Guide ...
Page 12: ...xii Dell PowerConnect W AirWave 7 6 User Guide ...
Page 112: ...100 Configuring and Using Device Groups Dell PowerConnect W AirWave 7 6 User Guide ...
Page 162: ...150 Discovering Adding and Managing Devices Dell PowerConnect W AirWave 7 6 User Guide ...
Page 198: ...186 Using RAPIDS and Rogue Classification Dell PowerConnect W AirWave 7 6 User Guide ...
Page 276: ...264 Creating Running and Emailing Reports Dell PowerConnect W AirWave 7 6 User Guide ...
Page 324: ...312 Using VisualRF Dell PowerConnect W AirWave 7 6 User Guide ...
Page 332: ...320 Index Dell PowerConnect W AirWave 7 6 User Guide ...


