6-9
Section
Graphs
245
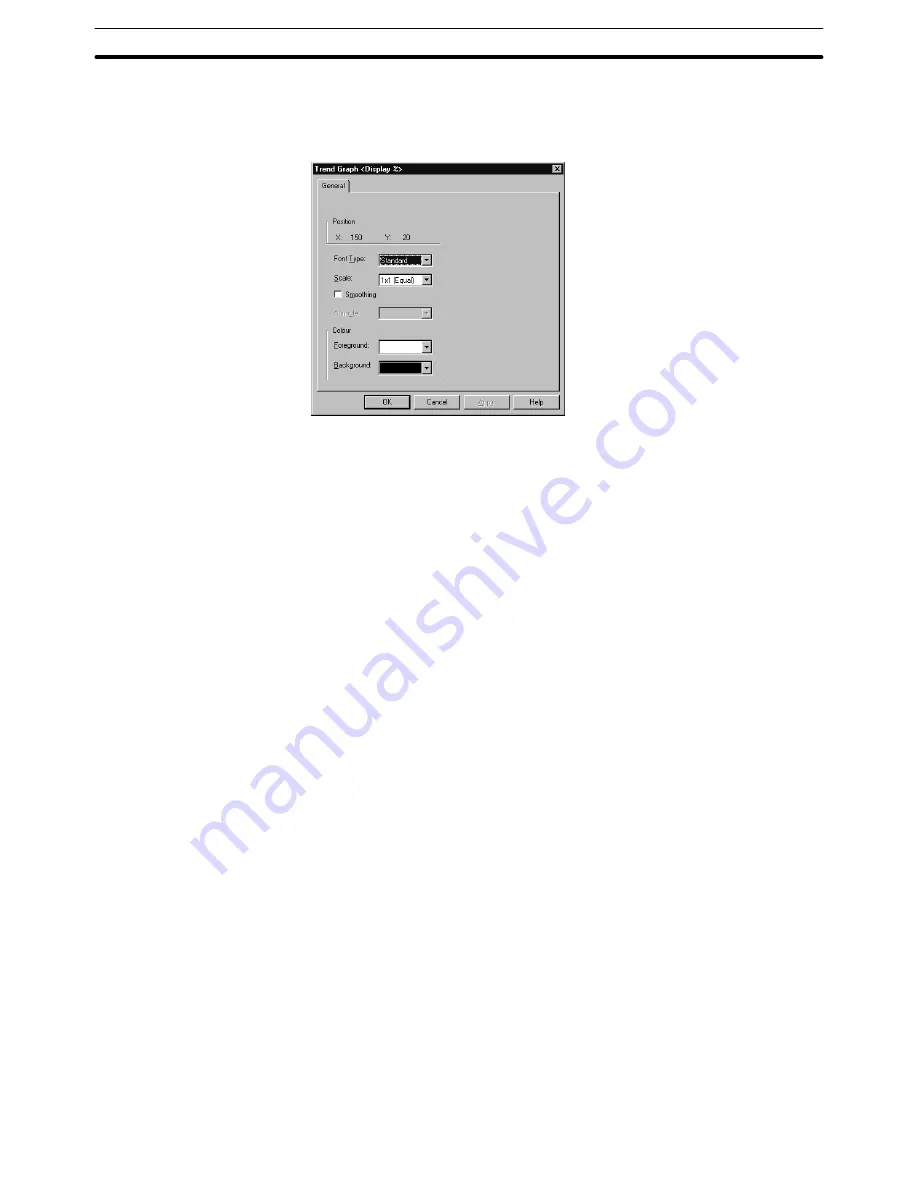
(3) To change the size of a displayed percentage value, double click on the val-
ue.
The properties of the percentage value display are displayed.
Position:
Indicates the display position of the percentage value.
(The reference point is at the upper left corner of the percentage
value.)
Font Type:
Specify the font of a value to be displayed.
Standard, Half Height, Double Width
Scale:
Specify the scale of a value to be displayed.
1
1 (Equal), 1
2 (High), 2
1 (Wide), 2
2, 3
3, 4
4, 8
8
Smoothing:
Specify whether or not smoothing processing is executed for a
value to be displayed.
Attribute:
The display attribute cannot be set (fixed as standard display).
Color
Foreground: Specify the color of the percentage value.
(Can only be set for PTs with color display.)
White, black, blue, red, magenta, green, cyan, yellow
Background: Specify the background color of the percentage value display
area.
(Can only be set for PTs with color display.)
White, black, blue, red, magenta, green, cyan, yellow
Reference:
A percentage value and other elements cannot be overlapped on a trend
graph.
With a trend graph, a percentage value can be displayed for each line. If there
are too many lines with percentage values and the correspondence between
the values and lines is not clear, use the procedure shown below to check the
line that corresponds to the percentage value.
(1) Select a trend graph.
(2) Select [Edit] (menu bar) – [Edit Object].
Or press Insert key (P122).
The trend graph element enters the edit enabled state and the
marks
surrounding the trend graph change to red.
Содержание NT - SUPPORT TOOL FOR WINDOWS V4
Страница 1: ...Support Tool for Windows Ver 4 Cat No V061 E1 05 NT series OPERATION MANUAL...
Страница 2: ...NT series Support Tool for Windows Ver 4 j Operation Manual Revised May 2007...
Страница 3: ...iv...
Страница 5: ...vi...
Страница 353: ...8 2 Section Library Editor 341 Double clicking the control menu box of the library editor Control menu box...


