• If you change the scale of a synchronized chart
window, all radar windows change range to match.
Synchronizing the chart and radar range
In the 2D chart view:
1. Select
Menu
.
2. Select
Presentation
.
3. Select
View & Motion
4. Select
Chart Sync
.
5. Select
Radar
.
Note:
Radar range synchronization is not available
when the chart motion mode is set to Auto Range.
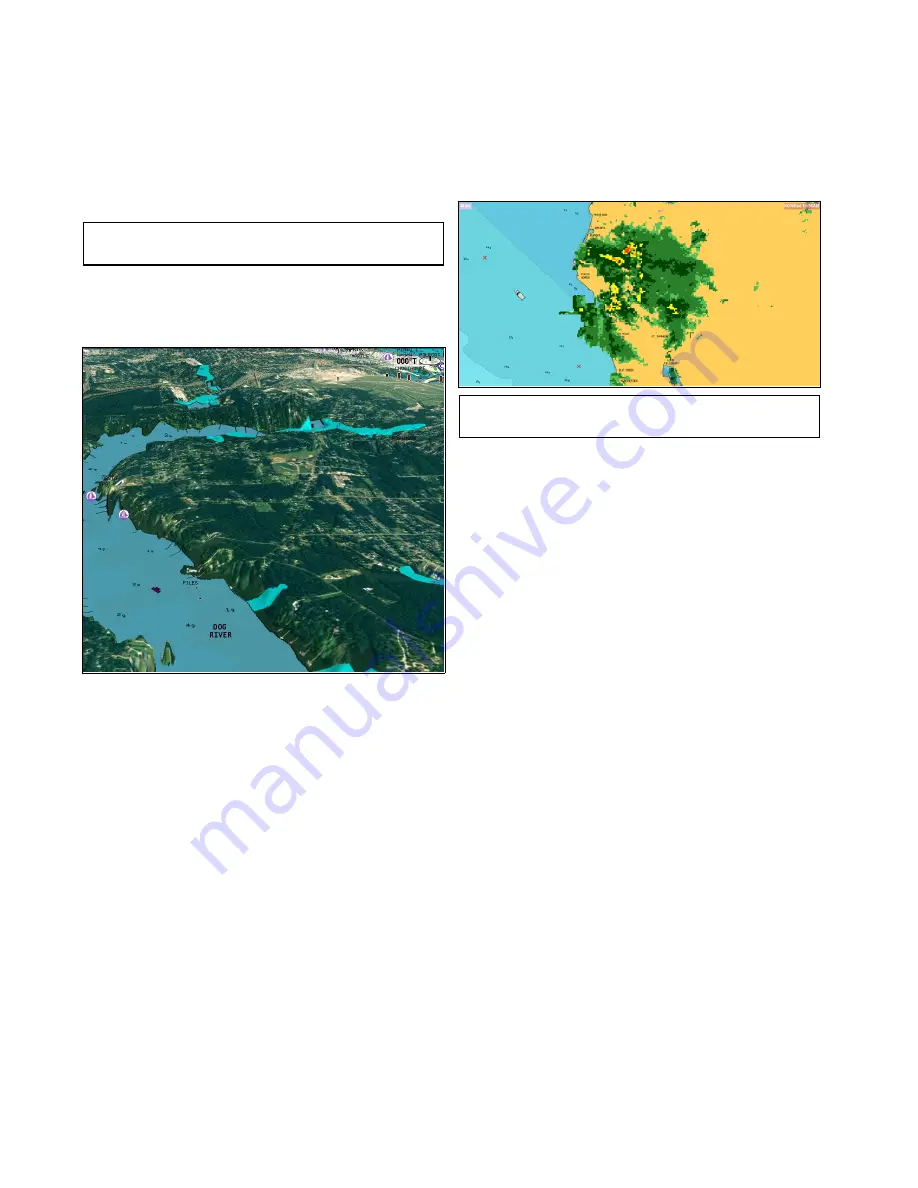
Aerial photo overlay
Your electronic charts may include aerial
photography.
Aerial photos cover the navigable waters up to
3 miles inside the coastline. The resolution is
dependent on the region covered by the chart card.
Enabling aerial photo overlay
From the chart application:
1. Select
Menu
.
2. Select
Presentation
.
3. Select
Overlays
.
4. Select
Aerial
.
The aerial opacity slider bar control is displayed
showing the current opacity percentage.
5. Adjust the slider bar to the required opacity, or
6. Select
Off
to turn the aerial overlay off.
Specifying the aerial overlay area
From the Chart application menu:
1. Select
Presentation
.
2. Select
Overlays
.
3. Select
Aerial Overlay:
.
A list of overlay options is displayed.
4. Select either On Land, On Land and Shallows, or
On Land and Sea.
The chart display is redrawn showing the new
overlay selection.
NOWRad weather overlay
With a suitable weather receiver connected to your
multifunction display, you can overlay NOWRad
weather information on the chart display.
The NOWRad weather overlay provides NOWRad
weather information and reports in the chart
application. You can adjust the intensity of the
overlay to achieve optimal visibility of both chart and
weather information.
Note:
The NOWRad weather overlay can only be
used in North America and its coastal waters.
Enabling NOWRad weather overlay on the chart
In the 2D chart view:
1. Select
Menu
.
2. Select
Presentation
.
3. Select
Overlays
.
4. Select
NOWRad
.
The NOWRad opacity slider bar control
is displayed showing the current opacity
percentage.
5. Adjust the slider bar to the required opacity, or
6. Select
Off
to turn the NOWRad overlay off.
Viewing weather reports from the chart
application
In the 2D chart view:
1. Select
Menu
.
2. Select
Weather Reports
.
3. Select
Report At
to switch between weather
reports from Ship or Cursor location.
4. Select either Tropical Statements, Marine
Warnings, Marine Zone Forecasts, or Watchbox
Warnings.
Databoxes
Databoxes can be displayed in the application
window.
The databoxes can be switched on and off and the
data that is displayed can be customized.
236
gS Series
Содержание Raymarine gS 195
Страница 2: ......
Страница 26: ...26 gS Series...
Страница 43: ...D 36 mm 1 4 in E 39 2 mm 1 5 in F 90 mm 3 5 in Planning the installation 43...
Страница 44: ...44 gS Series...
Страница 110: ...110 gS Series...
Страница 146: ...146 gS Series...
Страница 174: ...174 gS Series...
Страница 175: ...Chapter 13 Man Overboard MOB Chapter contents 13 1 Man overboard on page 176 Man Overboard MOB 175...
Страница 178: ...178 gS Series...
Страница 181: ...Chapter 15 Fuel manager Chapter contents 15 1 Fuel manager overview on page 182 Fuel manager 181...
Страница 196: ...196 gS Series...
Страница 218: ...218 gS Series...
Страница 328: ...328 gS Series...
Страница 362: ...362 gS Series...
Страница 411: ...Chapter 31 Technical specification Chapter contents 31 1 Technical specification on page 412 Technical specification 411...
Страница 418: ...418 gS Series...
Страница 438: ...438 gS Series...
Страница 439: ......
Страница 440: ...www raymarine com...


