18.9 Chart views
If supported by your cartography type, the Chart
application can be set to either 2D or 3D view.
Selecting 2D and 3D chart views
You can switch between 2D and 3D views in the
chart application if supported by your cartography.
From the chart application menu:
1. Select
Presentation
.
2. Select
View & Motion
.
3. Select
Chart View
to select 2D or 3D.
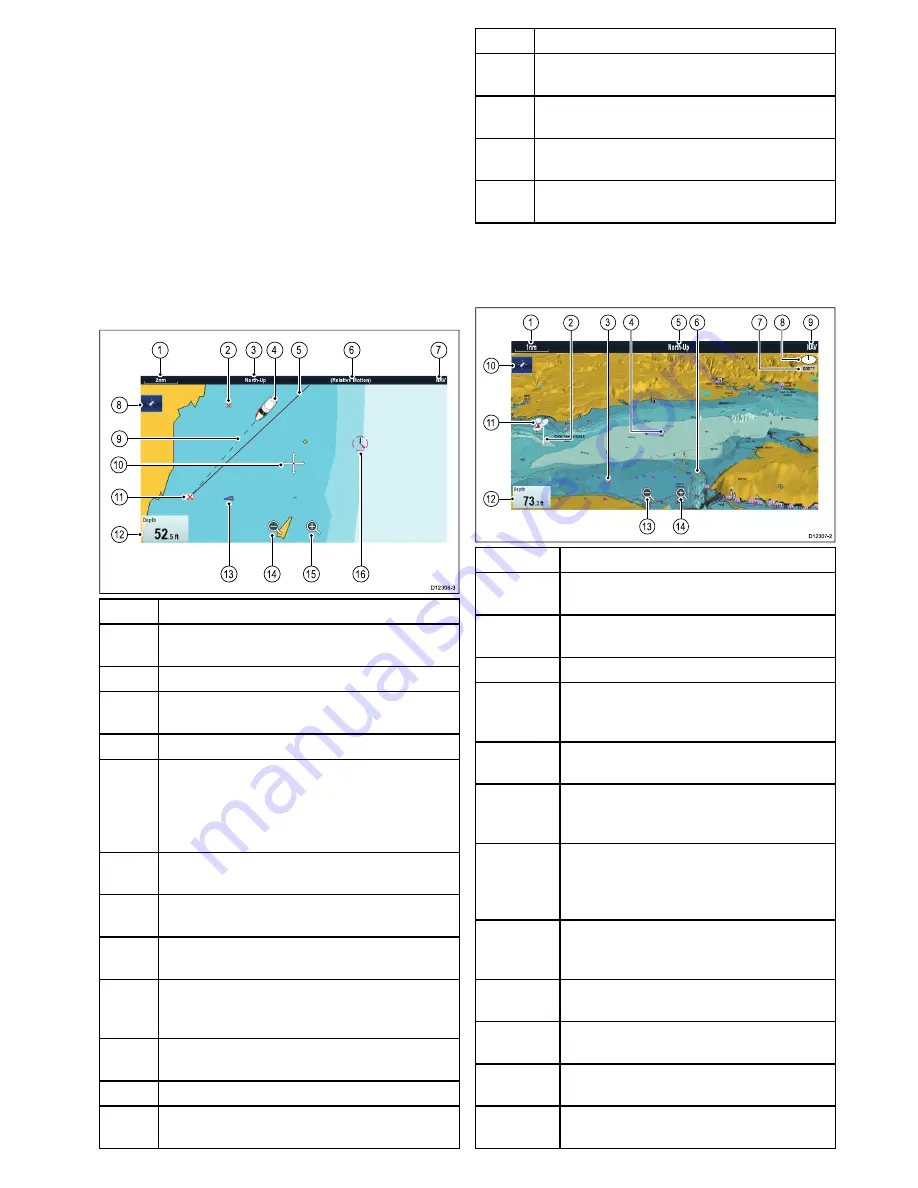
2D chart view
The 2D chart view can display a range of information
to help you navigate.
D12306-3
1
2
3
6
7
4
5
1
4
1
5
1
6
1
3
8
1
1
9
1
0
1
2
Item
Description
1
Range
— horizontal chart scale indicator (shown in
selected system units).
2
Waypoint
— inactive.
3
Orientation
— states the orientation mode that the
chart is using (North-up, Head-up, or Course-up).
4
Vessel symbol
— shows your current position.
5
Navigation origin line
— during navigation, shows
a solid line from the starting point to the target
waypoint. The starting point can be the vessel’s
original location, the point of XTE reset or the point
the current leg of a route was initiated.
6
Motion mode
— states the current motion mode
(Relative, True, or Auto Range).
7
Chart type
— indicates the type of chart in use —
Fish or Navigation.
8
Find ship icon
— used to find and center your
vessel on the chart.
9
Vessel position line
— during navigation, shows
a dotted line from the vessel’s current position to
the target waypoint.
10
Cursor
— used to select chart objects and move
around the chart area.
11
Target waypoint
— current target waypoint.
12
Databoxes
— used to display data such as depth
on the chart screen.
Item
Description
13
AIS target
— a vessel broadcasting AIS information
(optional).
14
Range out
— select icon to range out (Touchscreen
displays only).
15
Range in
— select icon to range in (Touchscreen
displays only).
16
Cartographic objects
— level of cartographic
objects is determined by the cartography type.
3D chart view
The 3D view can display a range of information to
help you navigate.
000°T
1
5
6
9
1
0
1
1
1
2
3
2
8
4
7
1
4
1
3
D12307-2
Item
Description
1
Range
— horizontal chart scale indicator
(shown in selected system units).
2
Depth Scale
— approximate depth beneath
your vessel (optional).
3
Waypoint
— optional.
4
Center-of-view
— the white cross indicates
the center of chart view at the water level
(optional).
5
Orientation
— states the orientation mode
that the chart is using.
6
Cartographic objects
— use the Cartography
Set-up menu to choose which objects to
display.
7
Rotation
— shows in degrees true, how far
the on-screen view has been rotated from your
vessel's heading and the tilt angle of your
vessel.
8
North arrow
– 3D indication of True North in
relation to the chart view. The north arrow also
tilts to indicate pitch angle.
9
Chart type
— indicates the type of chart in use
— Fish or Navigation.
10
Find ship icon
— used to find and center your
vessel on the chart.
11
Vessel symbol
— your vessel's current
position.
12
Data overlay
— used to display data such as
depth on the chart screen.
Chart application
231
Содержание Raymarine gS 195
Страница 2: ......
Страница 26: ...26 gS Series...
Страница 43: ...D 36 mm 1 4 in E 39 2 mm 1 5 in F 90 mm 3 5 in Planning the installation 43...
Страница 44: ...44 gS Series...
Страница 110: ...110 gS Series...
Страница 146: ...146 gS Series...
Страница 174: ...174 gS Series...
Страница 175: ...Chapter 13 Man Overboard MOB Chapter contents 13 1 Man overboard on page 176 Man Overboard MOB 175...
Страница 178: ...178 gS Series...
Страница 181: ...Chapter 15 Fuel manager Chapter contents 15 1 Fuel manager overview on page 182 Fuel manager 181...
Страница 196: ...196 gS Series...
Страница 218: ...218 gS Series...
Страница 328: ...328 gS Series...
Страница 362: ...362 gS Series...
Страница 411: ...Chapter 31 Technical specification Chapter contents 31 1 Technical specification on page 412 Technical specification 411...
Страница 418: ...418 gS Series...
Страница 438: ...438 gS Series...
Страница 439: ......
Страница 440: ...www raymarine com...


