Exinda Network Orchestrator
3 Using
|
252
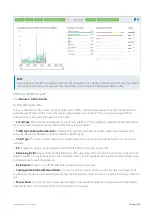
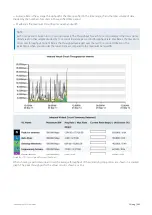
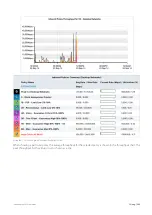
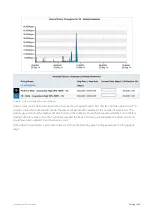
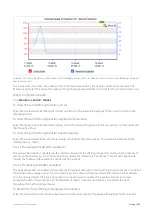
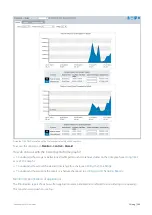
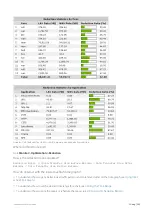
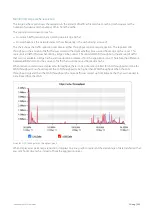
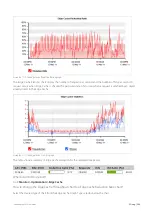
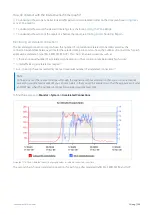
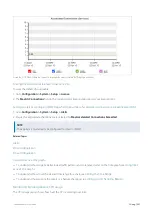
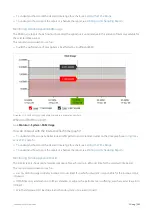
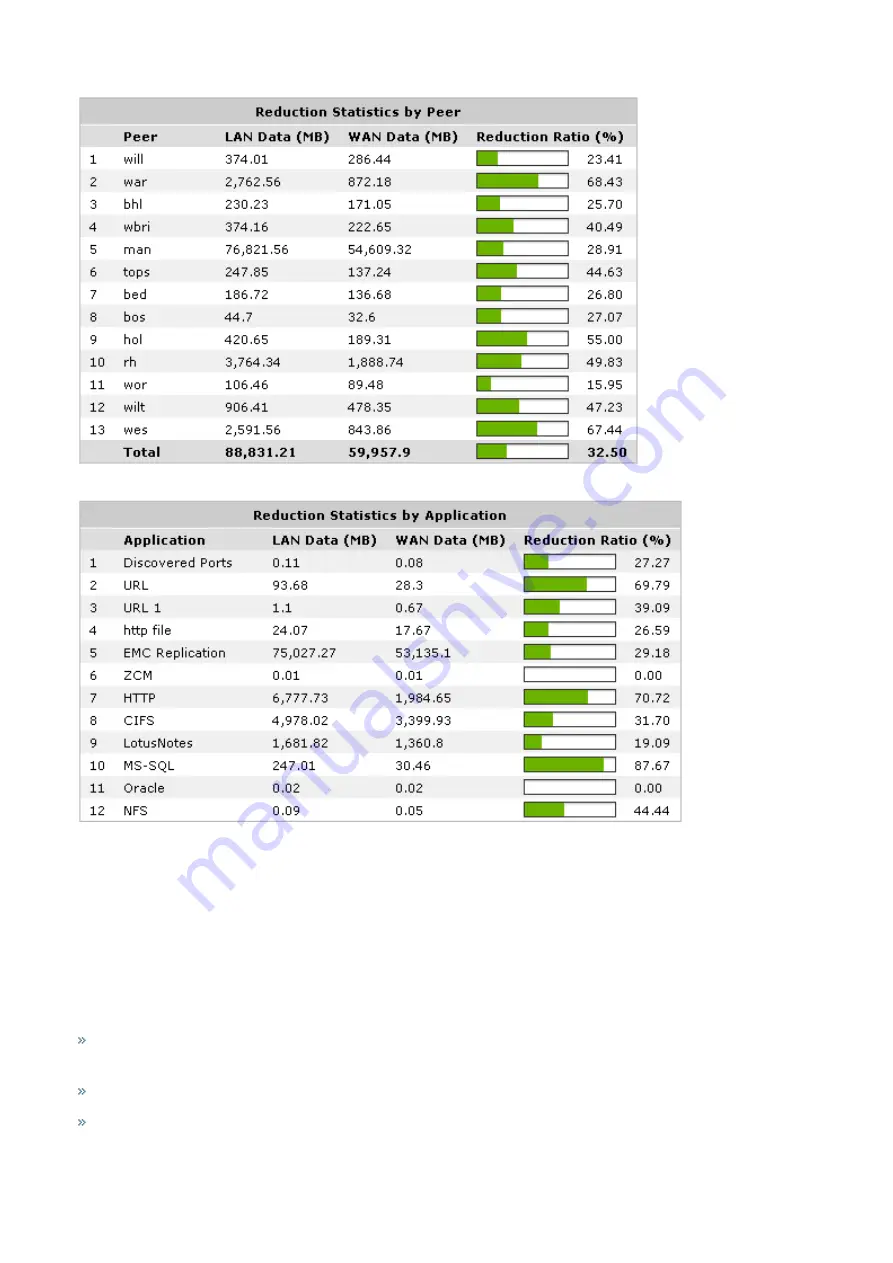
Screenshot 108: The Reduction Statistics charts compares peer and application reduction.
Where do I find this report?
Go to
Monitor > Optimization > Reduction
.
How is the reduction ratio calculated?
Reduction Ratio = (Data Transfer Size Before Exinda - Data Transfer Size After
Exinda) / Data Transfer Size Before Exinda
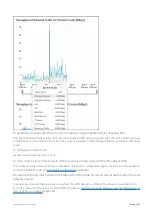
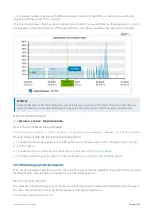
How do I interact with the interactive flash time graphs?
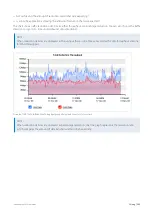
To understand how to get a better look at traffic patterns and to remove clutter on the time graph, see
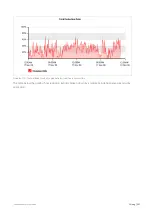
To understand how to set the desired time range for a chart, see
To understand how to print the report or schedule the report, see
Printing and Scheduling Reports
.
Содержание EXNV-10063
Страница 98: ...Exinda Network Orchestrator 2 Getting started 98 6 Click New The New Virtual Hard Disk wizard opens ...
Страница 99: ...Exinda Network Orchestrator 2 Getting started 99 7 Select VHDX as the Disk Format type and click Next ...
Страница 130: ...Exinda Network Orchestrator 2 Getting started 130 Screenshot 35 The life cycle of configuration status ...
Страница 369: ...Exinda Network Orchestrator 4 Settings 369 ...
Страница 411: ...Exinda Network Orchestrator 4 Settings 411 Screenshot 168 P2P OverflowVirtualCircuit ...
Страница 420: ...Exinda Network Orchestrator 4 Settings 420 Screenshot 175 Students OverflowVirtualCircuit ...
Страница 451: ...Exinda Network Orchestrator 4 Settings 451 ...

