
Exinda Network Orchestrator
3 Using
|
264
Application Performance solutions provide a predefined set of application monitors. Except for VoIP, application monitors
generate similar reports. TODO: CROSSREF VoIP
You can choose a monitor from the main [[[Undefined variable MyVariables.ExSoluCtr]]] screen or click the Custom
Application Performance link to bring up a list of applications to choose from.
NOTE
The report description lists the minimum version of Exinda OS required to run the report. If your Exinda OS does not
meet or exceed the requirement, the Run button will not be available.
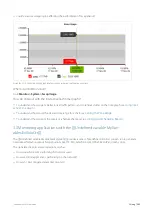
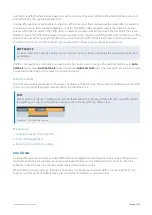
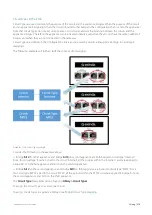
Understanding the data displayed in an Application Performance report
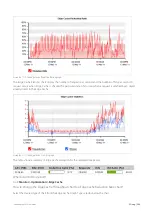
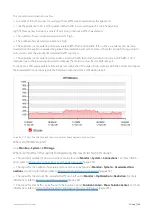
An Application Performance report shows the network user experience of an application through a series of charts,
tables and graphs.
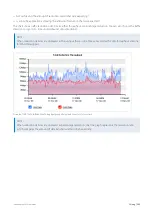
image
Screenshot 120: The Inbound Bandwidth chart shows data measured in the WAN-side before accelerated traffic is decompressed.
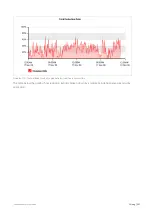
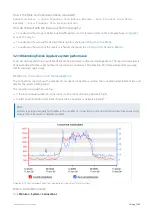
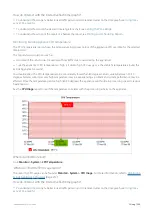
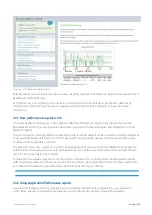
The Inbound and Outbound Bandwidth charts show how much bandwidth an application uses. Chart lines typically
show spikes instead of raised flat tops. Flat tops may indicate traffic limitations imposed by policy rules.
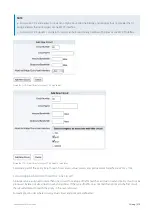
image
Screenshot 121: The Outbound Bandwidth chart shows data measured after acceleration and traffic shaping policies have been applied.
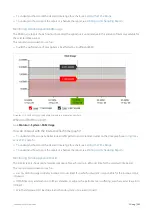
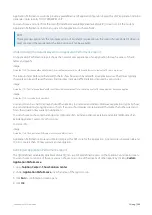
image
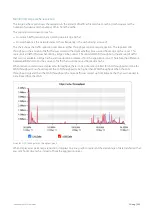
Screenshot 122: Users and hosts bar charts.
Users and Hosts bar charts display bandwidth volume by top listeners and talkers. Multi-user applications typically show
an even distribution among top users or hosts. If a user or host displays more bandwidth volume than other users and
hosts, that situation may warrant investigation.
You can choose to show internal endpoints (LAN-side of an Exinda Appliance), external endpoints (WAN-side of an
Exinda Appliance), users only or hosts only.
For more info ...
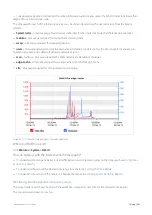
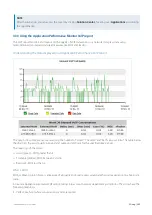
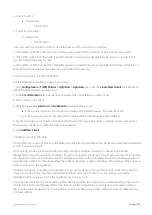
image
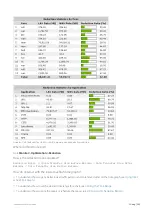
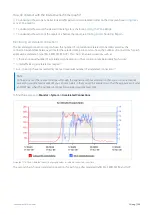
Screenshot 123: The Application Performance Scores and Metrics table.
Application Performance Scores and Metrics displays the APS score for the application. A good score is between 8.5 and
10.0. A score less than 7.0 may warrant an investigation.
Running an Application Performance report
The [[[Undefined variable MyVariables.ExSoluCtr]]] lists a set of predefined reports on the Solution Center main screen.
You can choose to run one of those or you can choose to run one of the dozens of other reports by clicking
Custom
Application Performance
.
1.
Go to
Solution Center > Show Solution Center
.
2.
Under
Application Performance
, click the name of the report to run
3.
Click
Run
. A confirmation screen opens.
4.
Click
Ok
.
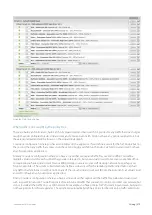
Содержание EXNV-10063
Страница 98: ...Exinda Network Orchestrator 2 Getting started 98 6 Click New The New Virtual Hard Disk wizard opens ...
Страница 99: ...Exinda Network Orchestrator 2 Getting started 99 7 Select VHDX as the Disk Format type and click Next ...
Страница 130: ...Exinda Network Orchestrator 2 Getting started 130 Screenshot 35 The life cycle of configuration status ...
Страница 369: ...Exinda Network Orchestrator 4 Settings 369 ...
Страница 411: ...Exinda Network Orchestrator 4 Settings 411 Screenshot 168 P2P OverflowVirtualCircuit ...
Страница 420: ...Exinda Network Orchestrator 4 Settings 420 Screenshot 175 Students OverflowVirtualCircuit ...
Страница 451: ...Exinda Network Orchestrator 4 Settings 451 ...