Exinda Network Orchestrator
3 Using
|
269
3.3.7 Setting a new baseline
Use the following instructions to set a new baseline for an application performance score. If you need to set a new
baseline, you should do this when you expect the application to perform reasonably well.
1.
Go to
Configuration > Objects > Service Levels > Application Performance Score (APS)
.
2.
Find and select the APS object.
NOTE
The object name includes "Solution Center" and is suffixed with an application ID.
3.
Select
Auto Baseline Period
and click
Start Baseline
.
3.3.8 Working with Application Performance charts
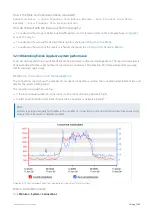
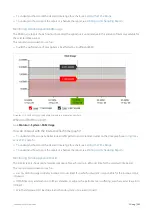
You can filter the data displayed on the page by toggling on and off the various charts. Click the buttons at the top of
the page to switch between the views. If a button is green, the data appears on the page.
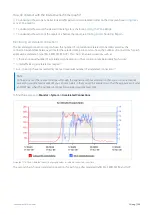
Determining throughput values for specific points in time in the throughput chart
Hover your cursor over the chart. A data brush will appear showing average throughput for the specific point in time.
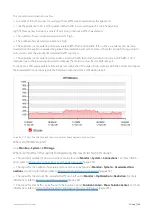
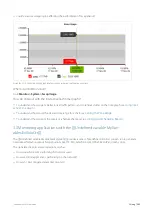
Investigating reduction due to acceleration, edge cache, and bandwidth shaping
Toggle on the LAN-side reporting to overlay the LAN-side values on the WAN-side values. The difference between the
LAN-side and WAN-side throughput lines indicates the amount of reduction that was achieved. Note that the total
reduction in data volume as a percentage is shown under the chart.
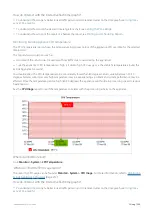
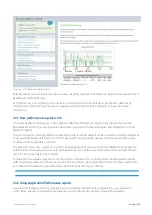
Investigating application usage by the top internal users and top internal hosts
Ensure the
Internal
button is toggled on and the
External
button is toggled off. The top hosts and top users (if
configured) found on the LAN-side of the appliance are shown.
Investigating application usage by the top external users and top external hosts
Ensure the
External
button is toggled on and the
Internal
button is toggled off. The top external hosts and top external
users (if configured) found on the WAN-side of the appliance are shown.
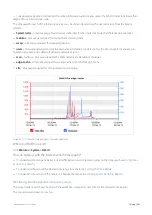
3.3.9 Investigating a poor application performance score (APS)
From an application performance chart, click
Show more
. A new screen charts the measures contributing to the APS:
Network delay and normalized network delay – the amount of time for data to traverse the network (on the wire)
Server delay and normalized server delay – the amount of time for a server to respond to a request
Round trip time – the amount of time for data to travel from a device across a network and return
Jitter – a measure of the variability of Network Delay. We define it as one standard deviation of the Network Delay.
Inbound loss and outbound loss – the amount of data retransmitted
Содержание EXNV-10063
Страница 98: ...Exinda Network Orchestrator 2 Getting started 98 6 Click New The New Virtual Hard Disk wizard opens ...
Страница 99: ...Exinda Network Orchestrator 2 Getting started 99 7 Select VHDX as the Disk Format type and click Next ...
Страница 130: ...Exinda Network Orchestrator 2 Getting started 130 Screenshot 35 The life cycle of configuration status ...
Страница 369: ...Exinda Network Orchestrator 4 Settings 369 ...
Страница 411: ...Exinda Network Orchestrator 4 Settings 411 Screenshot 168 P2P OverflowVirtualCircuit ...
Страница 420: ...Exinda Network Orchestrator 4 Settings 420 Screenshot 175 Students OverflowVirtualCircuit ...
Страница 451: ...Exinda Network Orchestrator 4 Settings 451 ...

