
Exinda Network Orchestrator
3 Using
|
259
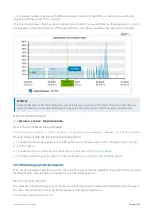
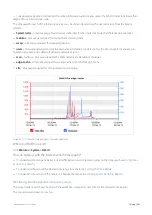
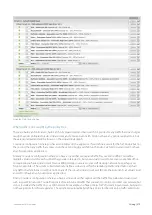
How do I interact with the interactive flash time graphs?
To understand how to get a better look at traffic patterns and to remove clutter on the time graph, see
To understand how to set the desired time range for a chart, see
To understand how to print the report or schedule the report, see
Printing and Scheduling Reports
.
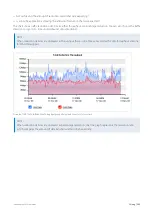
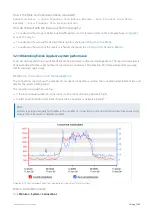
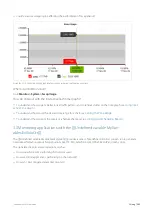
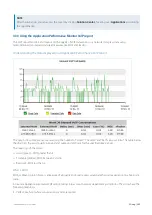
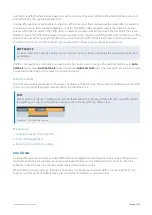
Monitoring Exinda Appliance CPU temperature
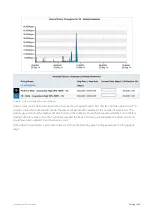
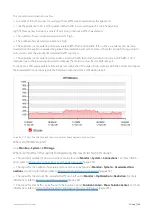
The CPU Temperature report shows the temperature in degrees Celsius of the appliance CPU over time for the selected
time period.
This report answers questions such as:
Are some of the other issues I'm seeing with my traffic due to overworking the appliance?
I see the appliance's CPU temperature is high. Is it due to high CPU usage or is the ambient temperature around the
Exinda Appliance too warm?
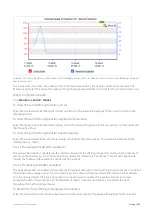
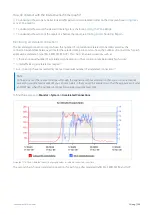
You should expect the CPU temperature to be considerably lower than 80 degrees Celsius, usually between 35-50
degrees. Systems running at very high temperatures may be experiencing a problem and system performance may be
affected. Once the temperature gets too high (80-90 degrees) the appliance will throttle its processing speed to reduce
heat emissions.
See the
CPU Usage
report to see if the temperature correlates with the processing activity on the appliance.
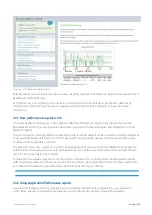
Where do I find this report?
Go to
Monitor > System > CPU Temperature
.
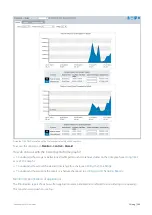
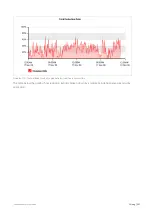
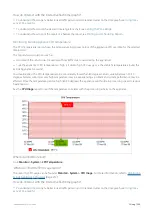
Where do I find the CPU Usage report?
The report for CPU usage can be found at
Monitor > System > CPU Usage
.
For more information, refer to
How do I interact with the interactive flash time graphs?
To understand how to get a better look at traffic patterns and to remove clutter on the time graph, see
Содержание EXNV-10063
Страница 98: ...Exinda Network Orchestrator 2 Getting started 98 6 Click New The New Virtual Hard Disk wizard opens ...
Страница 99: ...Exinda Network Orchestrator 2 Getting started 99 7 Select VHDX as the Disk Format type and click Next ...
Страница 130: ...Exinda Network Orchestrator 2 Getting started 130 Screenshot 35 The life cycle of configuration status ...
Страница 369: ...Exinda Network Orchestrator 4 Settings 369 ...
Страница 411: ...Exinda Network Orchestrator 4 Settings 411 Screenshot 168 P2P OverflowVirtualCircuit ...
Страница 420: ...Exinda Network Orchestrator 4 Settings 420 Screenshot 175 Students OverflowVirtualCircuit ...
Страница 451: ...Exinda Network Orchestrator 4 Settings 451 ...