Exinda Network Orchestrator
3 Using
|
194
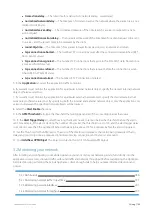
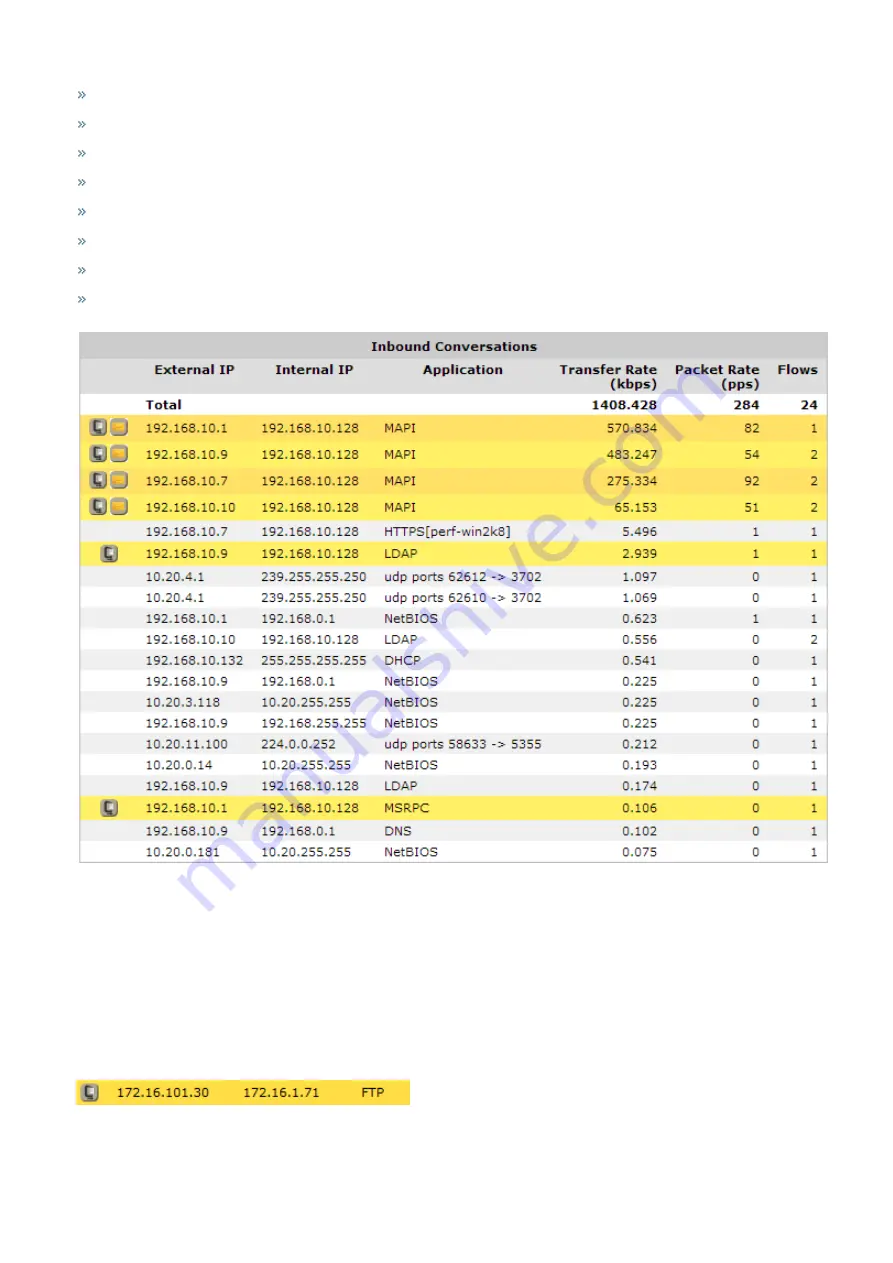
Filtering the conversations by IP address or subnet
Showing the user name associated with the internal IP address
Showing which policy the conversation falls into
Allowing connections within a flow to either be shown individually or to be grouped together
Highlighting accelerated conversations in yellow and indicating the acceleration technique used
Highlighting conversations processed by Edge Cache (in blue)
Indicating how the conversations is flowing through the high availability cluster
Indicating asymmetric traffic
Screenshot 71: The Conversation monitor report displays information about network traffic.
Where do I find this report?
Go to
Monitor > Real Time > Conversations
.
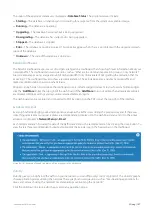
To understand the acceleration and high availability icons & coloring
Accelerated conversations are highlighted in yellow and the application acceleration technologies applied to that
conversation are displayed on the left-hand side as a series on icons.
For example, the FTP connection below is accelerated and processed by WAN Memory, indicated by the icon.
Conversations processed by Edge Cache (see the
Edge Cache "How-to" Guide
), are highlighted in blue.
Содержание EXNV-10063
Страница 98: ...Exinda Network Orchestrator 2 Getting started 98 6 Click New The New Virtual Hard Disk wizard opens ...
Страница 99: ...Exinda Network Orchestrator 2 Getting started 99 7 Select VHDX as the Disk Format type and click Next ...
Страница 130: ...Exinda Network Orchestrator 2 Getting started 130 Screenshot 35 The life cycle of configuration status ...
Страница 369: ...Exinda Network Orchestrator 4 Settings 369 ...
Страница 411: ...Exinda Network Orchestrator 4 Settings 411 Screenshot 168 P2P OverflowVirtualCircuit ...
Страница 420: ...Exinda Network Orchestrator 4 Settings 420 Screenshot 175 Students OverflowVirtualCircuit ...
Страница 451: ...Exinda Network Orchestrator 4 Settings 451 ...

