Exinda Network Orchestrator
3 Using
|
254
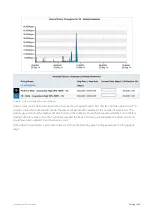
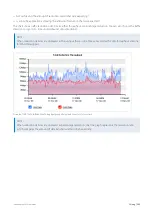
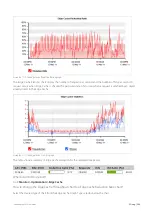
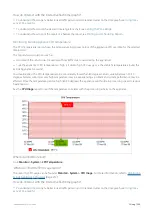
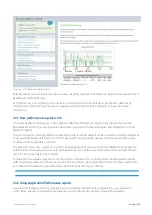
Screenshot 110: The Edge Cache Reduction Ration graph.
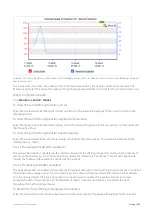
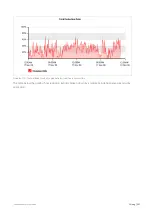
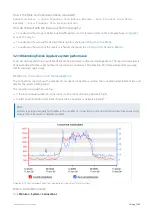
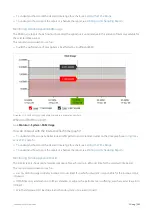
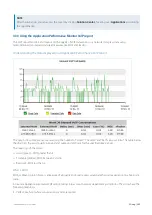
The Edge Cache Statistics chart display the number of requests per second and the number of hits per second. A
request occurs when Edge Cache is checked for particular data. A hit occurs when a request is satisfied by an object
already stored in the Edge Cache.
Screenshot 111: The Edge Cache Statistics graph.
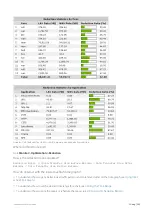
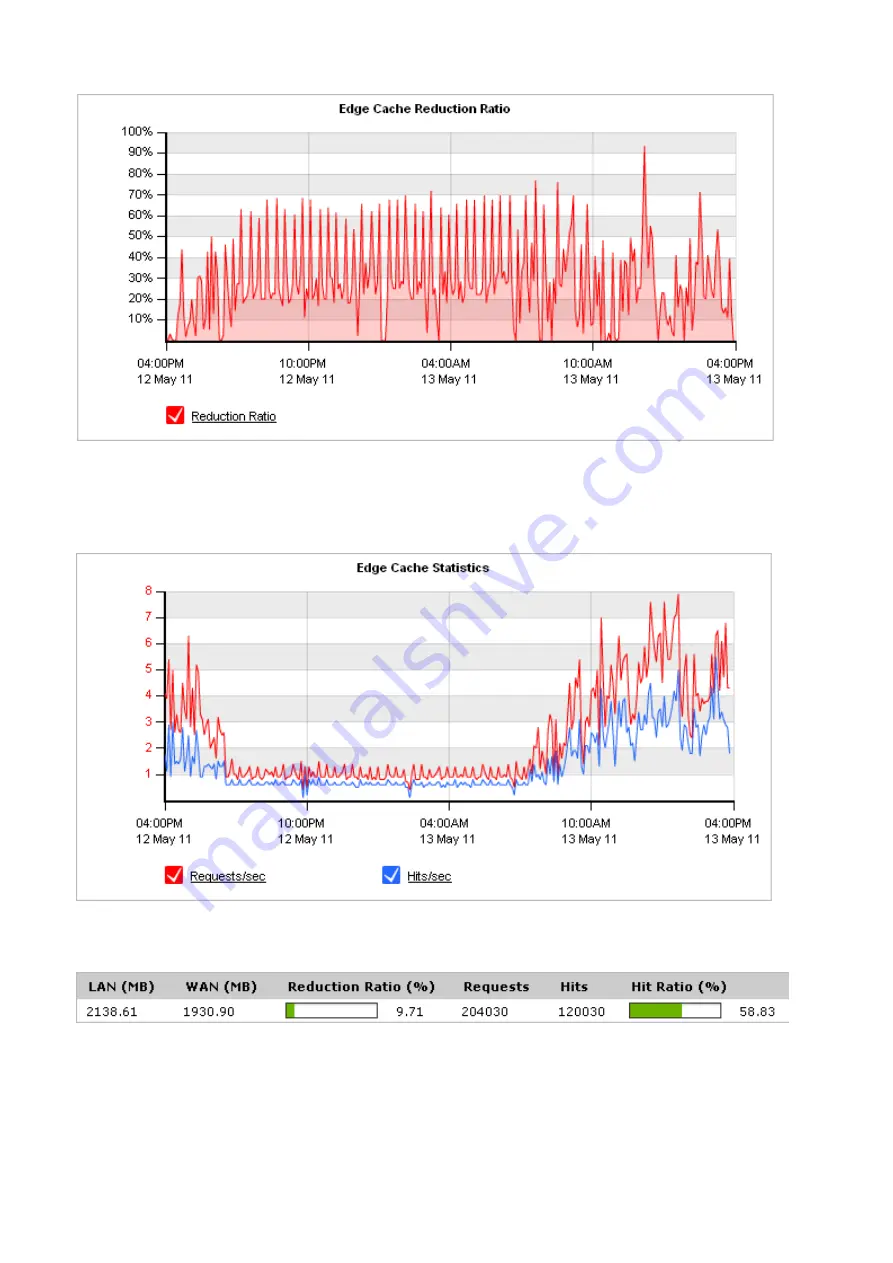
The table shows a summary of Edge Cache reduction for the selected time period.
Where do I find this report?
Go to
Monitor > Optimization > Edge Cache
.
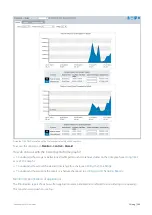
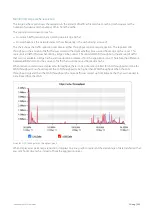
How to change the Edge Cache Throughput chart to a Edge Cache Reduction Ratio chart?
Select the desired type of chart from the Edge Cache Graph Type selector below the chart.
Содержание EXNV-10063
Страница 98: ...Exinda Network Orchestrator 2 Getting started 98 6 Click New The New Virtual Hard Disk wizard opens ...
Страница 99: ...Exinda Network Orchestrator 2 Getting started 99 7 Select VHDX as the Disk Format type and click Next ...
Страница 130: ...Exinda Network Orchestrator 2 Getting started 130 Screenshot 35 The life cycle of configuration status ...
Страница 369: ...Exinda Network Orchestrator 4 Settings 369 ...
Страница 411: ...Exinda Network Orchestrator 4 Settings 411 Screenshot 168 P2P OverflowVirtualCircuit ...
Страница 420: ...Exinda Network Orchestrator 4 Settings 420 Screenshot 175 Students OverflowVirtualCircuit ...
Страница 451: ...Exinda Network Orchestrator 4 Settings 451 ...

