Exinda Network Orchestrator
3 Using
|
202
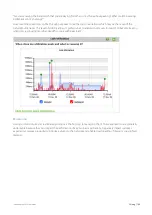
Was there a brief maximum burst or is the traffic consistently over average?”
The throughput for inbound traffic is shown separately from outbound traffic. The charts show maximum throughput
and average throughput.
Maximum throughput is determined by looking at 10 second samples of data. Average throughput is calculated by
averaging the amount of data transferred over the time period specified by the granularity.
For instance, when looking at a day of traffic, each data point represents 5 minutes of data. The average shows the
average data transferred over each 5 minute period. You can better understand the throughput distribution by adding a
percentile marker line. The line shows that the n
th
percentile of (maximum) throughput observations exceeds the
specified throughput rate. For instance, if the 95
th
percentile is at 55 Mbps, then 5 out of 100 maximum throughput
observations appeared above 55 Mbps.
The table at the bottom of the report shows the total amount of data transferred into and out of the WAN-side interface
(s), and the maximum and average throughput rates for the selected time period.
NOTE
Because this report shows all data on the wire, it may include traffic not seen on the WAN, such as local LAN
broadcasts, etc.
Содержание EXNV-10063
Страница 98: ...Exinda Network Orchestrator 2 Getting started 98 6 Click New The New Virtual Hard Disk wizard opens ...
Страница 99: ...Exinda Network Orchestrator 2 Getting started 99 7 Select VHDX as the Disk Format type and click Next ...
Страница 130: ...Exinda Network Orchestrator 2 Getting started 130 Screenshot 35 The life cycle of configuration status ...
Страница 369: ...Exinda Network Orchestrator 4 Settings 369 ...
Страница 411: ...Exinda Network Orchestrator 4 Settings 411 Screenshot 168 P2P OverflowVirtualCircuit ...
Страница 420: ...Exinda Network Orchestrator 4 Settings 420 Screenshot 175 Students OverflowVirtualCircuit ...
Страница 451: ...Exinda Network Orchestrator 4 Settings 451 ...


