


Exinda Network Orchestrator
3 Using
|
220
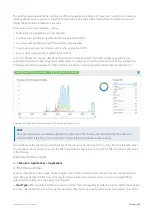
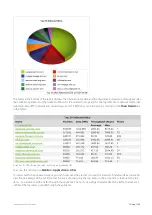
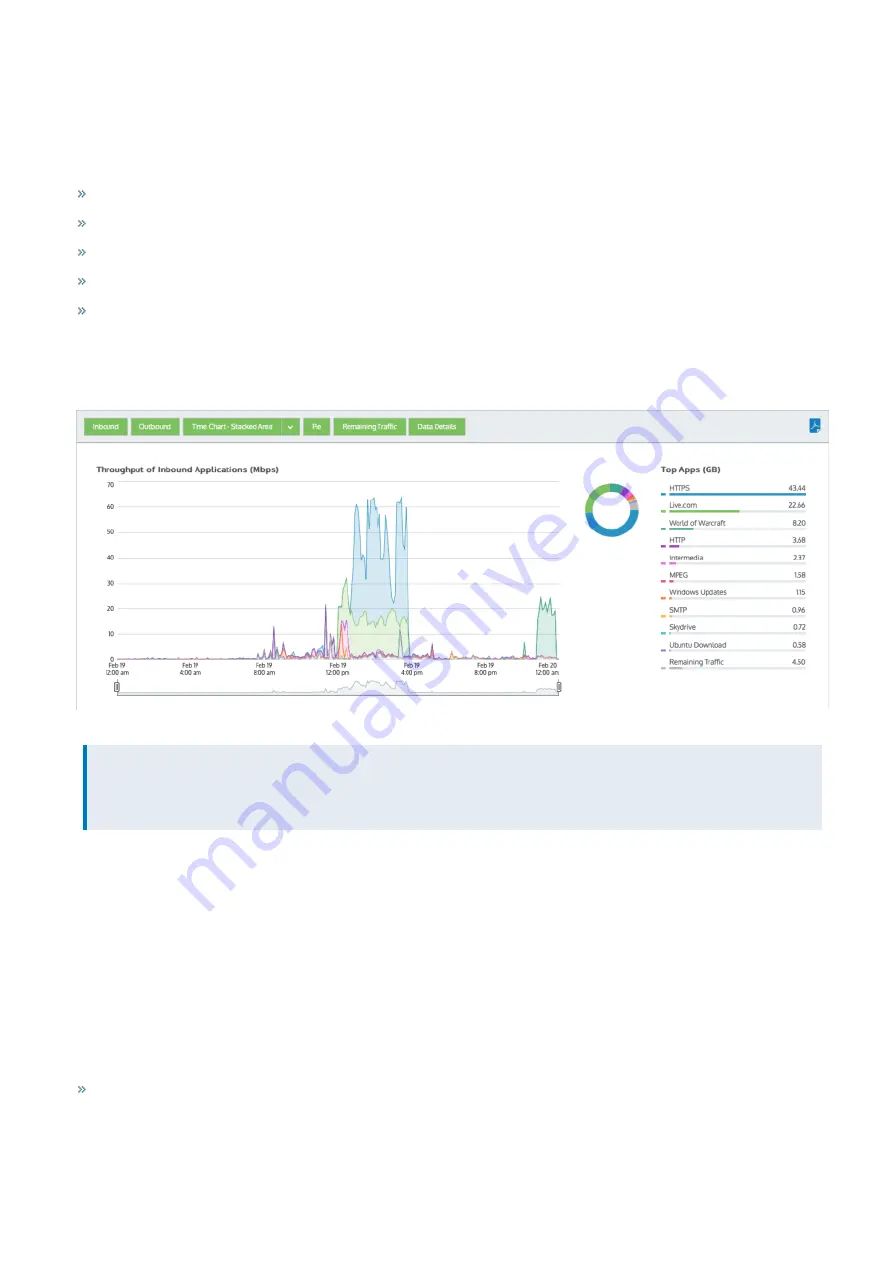
This will help you understand the significance of the top applications relative to the whole. In addition to showing a
stacked cumulative view, you can display the throughput as a line chart with a common zero baseline. You can also
display the application volumes as a pie chart.
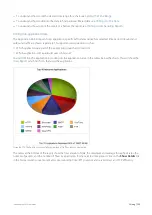
These charts can answer questions such as:
What are the top applications on my network?
Are those top applications significant relative to the entire traffic?
How much bandwidth does my FTP application typically take?
Could one application be choking out the other application traffic?
Do any of my top applications appear to be limited?
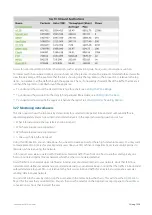
Using this information, you can determine if you need to create policies for high data volume applications and
applications that tend to have large data volume spikes. You may want to create protection policies for your business
critical apps and limiting policies for high volume non-business critical applications like recreational applications.
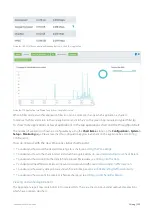
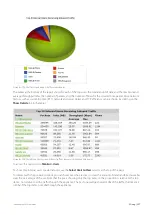
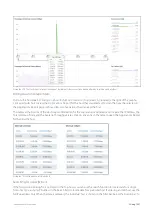
Screenshot 88: The Applications report shows traffic volume graphed over time.
NOTE
Average bandwidth is calculated as the total bits observed in the charting interval divided by the number of
seconds in that interval. E.g. For a chart with an hour of data, the intervals are five minutes.
If you drilled into the applications chart from any of the virtual circuit, subnets, or hosts charts, then the relevant virtual
circuit, subnet, or host will be shown on the filter bar below the button bar. To turn off the filtering, click on the close 'x'
in the filter tag.
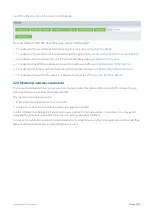
Where do I find this report?
Go to
Monitor > Applications > Applications
.
To filter the report data
Various components on the screen can be toggled on and off by clicking buttons above the charts. Note that when
generating a pdf report of this screen, the toggle states are taken into account. That is, if you had toggled off the
outbound charts, they will not be present in the pdf.
Host Type:
When you first load the Hosts report, Internal hosts are graphed by default. Click the Internal hosts button
and then select External hosts to change the type. Note that you cannot graph both internal and external hosts at the
Содержание EXNV-10063
Страница 98: ...Exinda Network Orchestrator 2 Getting started 98 6 Click New The New Virtual Hard Disk wizard opens ...
Страница 99: ...Exinda Network Orchestrator 2 Getting started 99 7 Select VHDX as the Disk Format type and click Next ...
Страница 130: ...Exinda Network Orchestrator 2 Getting started 130 Screenshot 35 The life cycle of configuration status ...
Страница 369: ...Exinda Network Orchestrator 4 Settings 369 ...
Страница 411: ...Exinda Network Orchestrator 4 Settings 411 Screenshot 168 P2P OverflowVirtualCircuit ...
Страница 420: ...Exinda Network Orchestrator 4 Settings 420 Screenshot 175 Students OverflowVirtualCircuit ...
Страница 451: ...Exinda Network Orchestrator 4 Settings 451 ...