Exinda Network Orchestrator
3 Using
|
230
Hosts that fall into a network object that was defined as
internal
are considered internal to your network
Hosts that fall into a network object that was defined as
external
are considered external to your network
Traffic is inbound and outbound relative to your LAN – not relative to the host. Therefore, inbound traffic for an external
host means that host was sending data inbound into your network.
Where do I find this report?
Go to
Monitor > Hosts
.
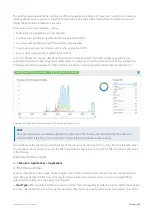
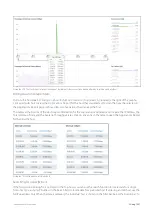
To filter the report data
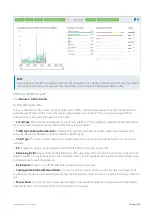
Toggle various chart elements on and off by clicking the buttons above the charts. Note that when generating a PDF
report of this screen, the toggle states are taken into account. That is, if you had toggled off the outbound charts, they
will not be present in the PDF.
Host Type:
When you first load the Hosts report, Internal hosts are graphed by default. Click the Internal hosts button
and then select External hosts to change the type. Note that you cannot graph both internal and external hosts at the
same time.
Traffic Type (Inbound/Outbound):
By default, both Inbound and Outbound traffic is graphed. Click either the
Inbound or Outbound option to hide the data. When viewing Internal hosts, hiding the Inbound data toggles off the
Top Listeners data from the graphs, whereas hiding the Outbound data toggles off the Top Talkers data. When viewing
External hosts, the opposite is true.
Chart Type:
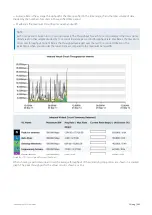
The chart is initially mapped as a Stacked Area , but you can change the format to Line Chart if necessary.
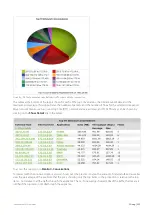
Pie:
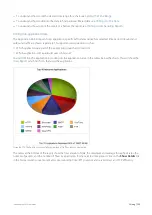
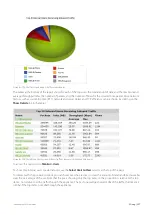
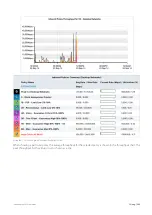
Toggles on or off a colour-coded Pie chart to the left of the Top Listeners and Top Talkers list.
Remaining Traffic:
Append or hide the Remaining Traffic data below the Top Listeners and Top Talkers lists. Reamin-
ing traffic represents the remaining application traffic on your network and the cumulative stack on the throughput
chart represents all the hosts communicating through the appliance. If the remaining traffic show vastly more data
volume than the top hosts, then the top hosts may look insignificant relative to the total, and so you may need to toggle
off the remaining traffic category to see the relative differences and usage patterns of the top hosts.
NOTE
If there are more than 100,000 hosts to display, it may take several minutes to render the screen when Remaining
Traffic is enabled.
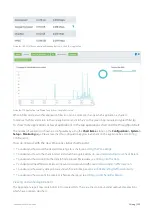
Data Details:
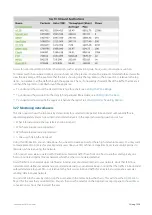
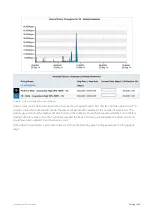
Toggles on or off the data tables below the time series charts.
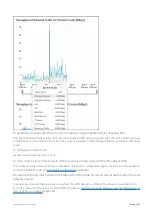
Mouse Hover:
Hover the mouse pointer over the graph to view data throughput at a given date and time. Refer to
Chart Interactions - Drill in & Data brush in
for details.
Содержание EXNV-10063
Страница 98: ...Exinda Network Orchestrator 2 Getting started 98 6 Click New The New Virtual Hard Disk wizard opens ...
Страница 99: ...Exinda Network Orchestrator 2 Getting started 99 7 Select VHDX as the Disk Format type and click Next ...
Страница 130: ...Exinda Network Orchestrator 2 Getting started 130 Screenshot 35 The life cycle of configuration status ...
Страница 369: ...Exinda Network Orchestrator 4 Settings 369 ...
Страница 411: ...Exinda Network Orchestrator 4 Settings 411 Screenshot 168 P2P OverflowVirtualCircuit ...
Страница 420: ...Exinda Network Orchestrator 4 Settings 420 Screenshot 175 Students OverflowVirtualCircuit ...
Страница 451: ...Exinda Network Orchestrator 4 Settings 451 ...


