UMSITRPDS3-1
On-Line Operation
November 2010
6-3
6.1.3 Unit/Bargraph Display
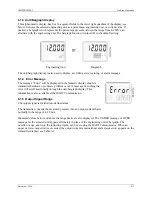
This alphanumeric display has five 14-segment fields in the lower right quadrant of the display; see
below. It shows the selected engineering unit as a percentage, engineering unit, or current value. If
desired, a bargraph which represents the percentage pressure value in the range from 0-100% can
alternate with the engineering unit. The bargraph function is turned off in the default setting.
Engineering Unit
Bargraph
The unit/bargraph display is also used to display a scrolling error, warning, or alarm message.
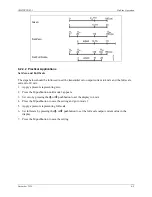
6.1.4 Error Message
The message “Error” will be displayed in the Numeric display should a
transmitter hardware or software problem occur. A message describing the
error will scroll horizontally through the unit/bargraph display. This
information is also available at the HART Communicator.
6.1.5 Output Signal Range
The output signal is divided into defined areas.
The transmitter converts the measured pressure into an output current that is
normally in the range of 4-20 mA.
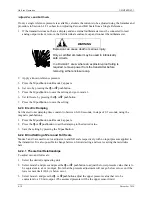
Measured values below and above the range limits are also displayed. The UNDER message or OVER
message for the selected unit appears alternately in place of the engineering unit or bargraph. The
overflow range, shown in the following figure, can be set using the HART Communicator. When an
upper or lower range limit is exceeded, the output current remains linear and a status arrow appears on the
transmitter display; see Table 6-1.
Содержание 7MF4033 series
Страница 48: ...Model 275 Universal Hart Communicator UMSITRPDS3 1 November 2010 2 26 ...
Страница 86: ...Installation UMSITRPDS3 1 November 2010 4 34 ...
Страница 152: ...Calibration and Maintenance UMSITRPSD3 1 November 2010 7 20 ...
Страница 158: ...Circuit Description UMSITRPDS3 1 November 2010 8 6 ...
Страница 197: ......
Страница 198: ......
Страница 200: ...Model Designations and Specifications UMSITRPDS3 1 November 2010 9 42 ...
Страница 204: ...Glossary UMSITRPDS3 1 November 2010 10 4 ...
Страница 208: ...Appendix A Online Configuration Map UMSITRPDS3 1 11 4 November 2010 ...
Страница 210: ...Appendix B Hazardous Area Installation UMSITRPDS3 1 12 2 November 2010 FIGURE 12 1 Control Drawing ...
Страница 211: ...UMSITRPDS3 1 Appendix B Hazardous Area Installation November 2010 12 3 FIGURE 12 2 Control Drawing ...
Страница 212: ...Appendix B Hazardous Area Installation UMSITRPDS3 1 12 4 November 2010 FIGURE 12 3 Control Drawing ...
Страница 216: ...Appendix C Elevation and Suppression Correction UMSITRPDS3 1 13 4 November 2010 ...


