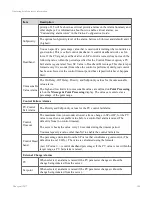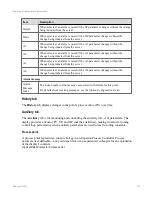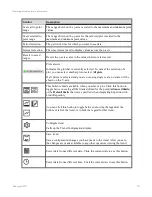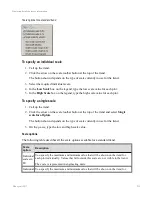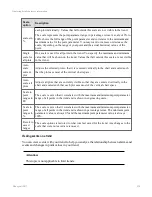
Button
Description
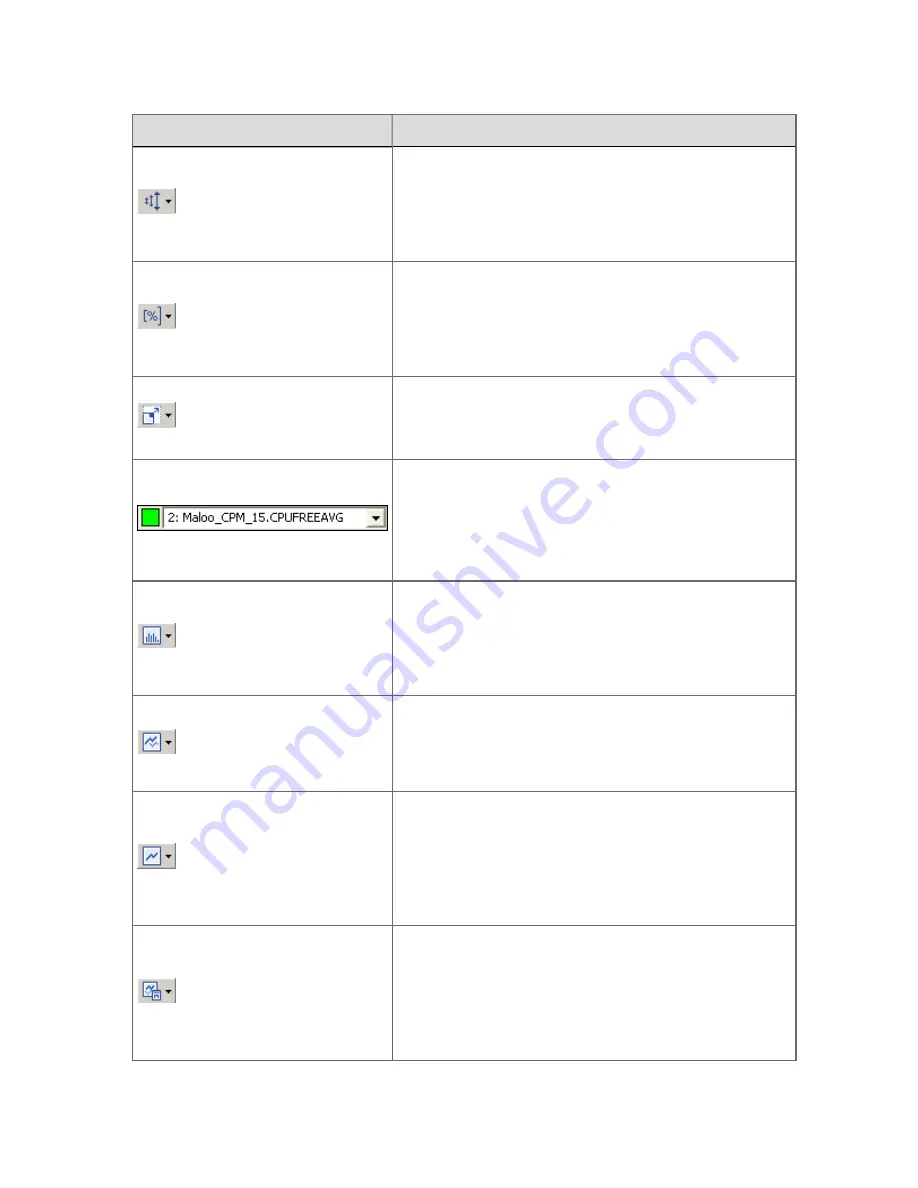
Individual scales in EU
Scaling used in the trend is separate for each point and is
in engineering units.
Click the arrow to change the scale.
Individual scales in %
Scaling used in the trend is separate for each point and is
shown as a percent.
Click the arrow to change the scale.
Single scale for all plots
The range displayed on the Y-axis is the same for all
plots.
Plot selector
Indicates the plot that is currently selected, or if no plot is
currently selected, indicates the last plot you selected. If
you are not using a single scale for all plots, the Y-axis
displays the scale for the plot that is shown in the box.
Display as bar graph
The selected point is displayed as a bar graph. Data for
the remaining points is obscured by the bar graph.
Click the arrow to change from a bar graph to a line graph.
Display as line graph
The plots are displays as line graphs.
Click the arrow to change from a line graph to a bar graph.
View trend only
Indicates the current view is a trend without the event
pane or the tabular history pane.
Click the arrow to change the view to Trend with Events
or Trend with Tabular History
View trend with tabular history
Indicates the current view is the trend with the tabular
history pane.
Click the arrow to change the view to Trend Only or
Trend with Events.
Displaying detailed process information
Honeywell 2017
223
Содержание Experion LX
Страница 1: ...Experion LX Operator s Guide EXDOC XX80 en 500A April 2017 Release 500 ...
Страница 77: ...Button Description toolbar Using faceplates Honeywell 2017 77 ...
Страница 249: ...n Restart n Hold n Stop n Abort n Resume n Active n Cancel About activities batches and procedures Honeywell 2017 249 ...

