
800
Data Collection and Analysis
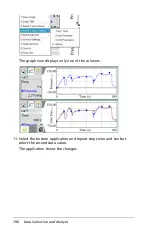
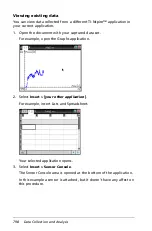
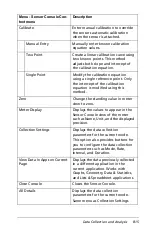
You can now work with the data in the current application.
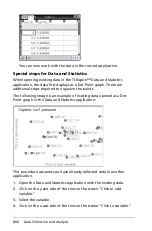
Special steps for Data and Statistics
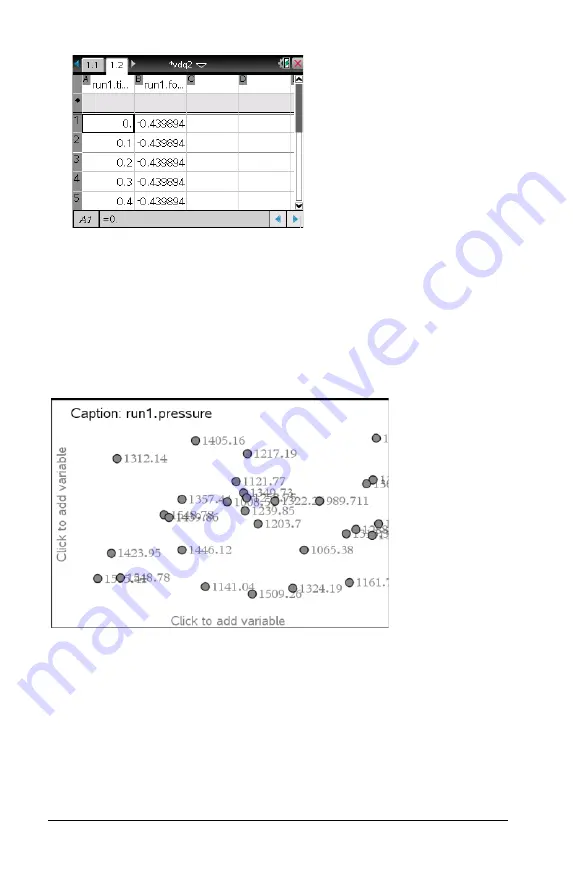
When opening existing data in the TI-Nspire™ Data and Statistics
application, the data first displays as a Dot Point graph. There are
additional steps required to organize the points.
The following image is an example of existing data opened as a Dot
Point graph in the Data and Statistics application:
This procedure assumes you have already collected data in another
application.
1. Open the Data and Statistics application with the existing data.
2. Click on the y-axis side of the text on the screen “Click to add
variable.”
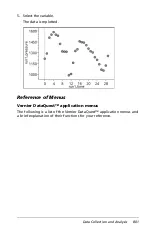
3. Select the variable.
4. Click on the x-axis side of the text on the screen “Click to variable.”
Summary of Contents for TI-Nspire
Page 38: ...26 Setting up the TI Nspire Navigator Teacher Software ...
Page 46: ...34 Getting started with the TI Nspire Navigator Teacher Software ...
Page 84: ...72 Using the Content Workspace ...
Page 180: ...168 Capturing Screens ...
Page 256: ...244 Embedding documents in web pages ...
Page 336: ...324 Polling students ...
Page 374: ...362 Using the Review Workspace ...
Page 436: ...424 Calculator ...
Page 450: ...438 Using Variables ...
Page 602: ...590 Using Lists Spreadsheet ...
Page 676: ...664 Using Notes You can also change the sample size and restart the sampling ...
Page 684: ...672 Libraries ...
Page 714: ...702 Programming ...
Page 828: ...816 Data Collection and Analysis ...
Page 846: ...834 Regulatory Information ...
Page 848: ...836 ...


