

598
Using Data & Statistics
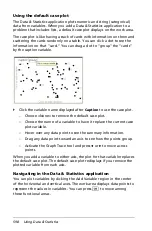
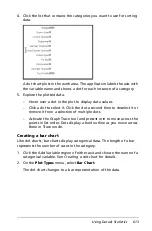
Using
the default case plot
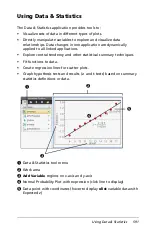
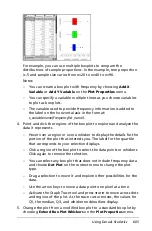
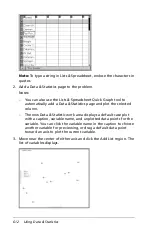
The Data & Statistics application plots numeric and string (categorical)
data from variables. When you add a Data & Statistics application to a
problem that includes lists, a default case plot displays on the work area.
The case plot is like having a stack of cards with information on them and
scattering the cards randomly on a table. You can click a dot to see the
information on that “card.” You can drag a dot to “group” the “cards”
by the caption variable.
`
Click the variable name displayed after
Caption
to use the case plot.
–
Choose <None> to remove the default case plot.
–
Choose the name of a variable to have it replace the current case
plot variable.
–
Hover over any data point to see the summary information.
–
Drag any data point toward an axis to see how the points group.
–
Activate the Graph Trace tool and press
7
or
8
to move across
points.
When you add a variable to either axis, the plot for that variable replaces
the default case plot. The default case plot redisplays if you remove the
plotted variable from each axis.
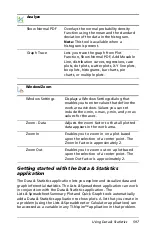
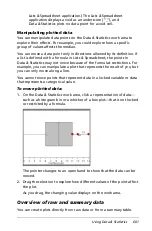
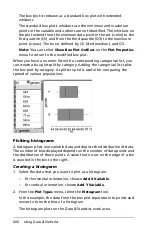
Navigating in the Data & Statistics application
You can plot variables by clicking the Add Variable region in the center
of the horizontal and vertical axes. The work area displays data points to
represent the values in variables. You can press
e
to move among
these functional areas.
Summary of Contents for TI-Nspire
Page 38: ...26 Setting up the TI Nspire Navigator Teacher Software ...
Page 46: ...34 Getting started with the TI Nspire Navigator Teacher Software ...
Page 84: ...72 Using the Content Workspace ...
Page 180: ...168 Capturing Screens ...
Page 256: ...244 Embedding documents in web pages ...
Page 336: ...324 Polling students ...
Page 374: ...362 Using the Review Workspace ...
Page 436: ...424 Calculator ...
Page 450: ...438 Using Variables ...
Page 602: ...590 Using Lists Spreadsheet ...
Page 676: ...664 Using Notes You can also change the sample size and restart the sampling ...
Page 684: ...672 Libraries ...
Page 714: ...702 Programming ...
Page 828: ...816 Data Collection and Analysis ...
Page 846: ...834 Regulatory Information ...
Page 848: ...836 ...