

604
Using Data & Statistics
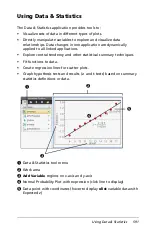
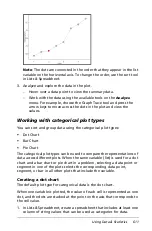
Note:
If two variables are plotted in the work area, you can create a
dot plot by removing one variable. Choose
Remove X
Variable
or
Remove Y
Variable
from the
Plot Types
menu.
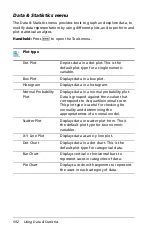
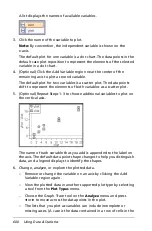
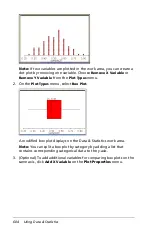
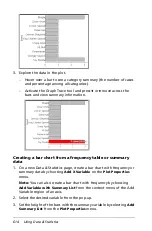
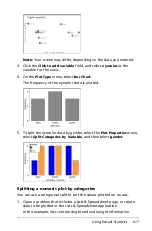
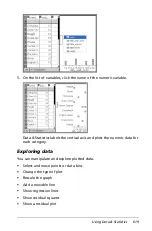
2. On the
Plot Types
menu, select
Box Plot
.
A modified box plot displays on the Data & Statistics work area.
Note:
You can split a box plot by category by adding a list that
contains corresponding categorical data to the y-axis.
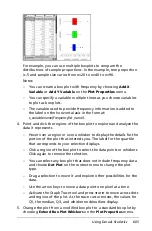
3. (Optional) To add additional variables for comparing box plots on the
same axis, click
Add X Variable
on the
Plot Properties
menu.
Summary of Contents for TI-Nspire
Page 38: ...26 Setting up the TI Nspire Navigator Teacher Software ...
Page 46: ...34 Getting started with the TI Nspire Navigator Teacher Software ...
Page 84: ...72 Using the Content Workspace ...
Page 180: ...168 Capturing Screens ...
Page 256: ...244 Embedding documents in web pages ...
Page 336: ...324 Polling students ...
Page 374: ...362 Using the Review Workspace ...
Page 436: ...424 Calculator ...
Page 450: ...438 Using Variables ...
Page 602: ...590 Using Lists Spreadsheet ...
Page 676: ...664 Using Notes You can also change the sample size and restart the sampling ...
Page 684: ...672 Libraries ...
Page 714: ...702 Programming ...
Page 828: ...816 Data Collection and Analysis ...
Page 846: ...834 Regulatory Information ...
Page 848: ...836 ...


