392
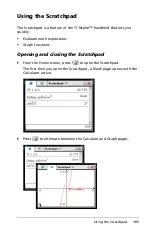
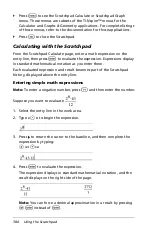
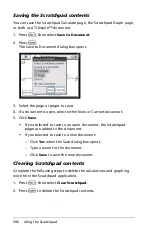
Using the Scratchpad
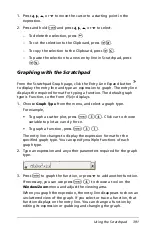
As you graph multiple functions on the axes, the label containing the
expression displays for each. You can define and graph a maximum of
99 functions of each type.
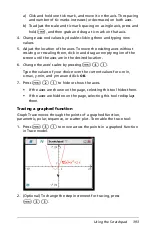
4. Use the
b
key to explore and analyze the graphed function by
tracing it, finding points of interest, or assigning a variable in the
expression to a slider.
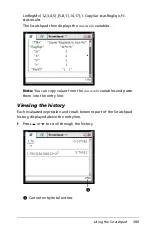
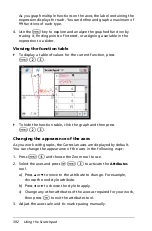
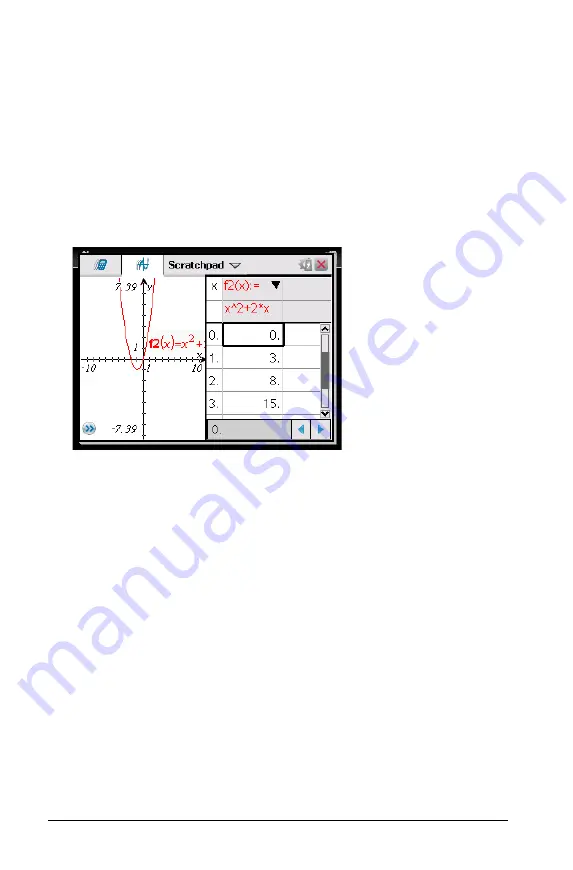
Viewing the function table
`
To display a table of values for the current function, press
b 2 5
.
`
To hide the function table, click the graph and then press
b 2 5
.
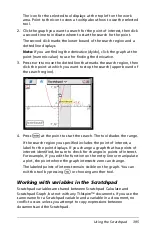
Changing the appearance of the axes
As you work with graphs, the Cartesian axes are displayed by default.
You can change the appearance of the axes in the following ways:
1. Press
b 4
and choose the Zoom tool to use.
2. Select the axes and press
/ b 3
to activate the
Attributes
tool.
a) Press
9
or
:
to move to the attribute to change. For example,
choose the end style attribute.
b) Press
7
or
8
to choose the style to apply.
c) Change any other attributes of the axes as required for your work,
then press
d
to exit the attributes tool.
3. Adjust the axes scale and tic mark spacing manually.
Summary of Contents for TI-Nspire
Page 38: ...26 Setting up the TI Nspire Navigator Teacher Software ...
Page 46: ...34 Getting started with the TI Nspire Navigator Teacher Software ...
Page 84: ...72 Using the Content Workspace ...
Page 180: ...168 Capturing Screens ...
Page 256: ...244 Embedding documents in web pages ...
Page 336: ...324 Polling students ...
Page 374: ...362 Using the Review Workspace ...
Page 436: ...424 Calculator ...
Page 450: ...438 Using Variables ...
Page 602: ...590 Using Lists Spreadsheet ...
Page 676: ...664 Using Notes You can also change the sample size and restart the sampling ...
Page 684: ...672 Libraries ...
Page 714: ...702 Programming ...
Page 828: ...816 Data Collection and Analysis ...
Page 846: ...834 Regulatory Information ...
Page 848: ...836 ...