
Using Data & Statistics
619
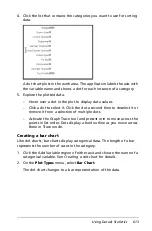
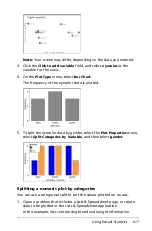
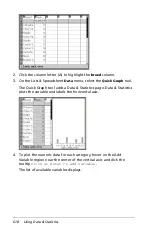
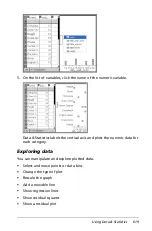
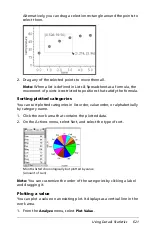
5. On the list of variables, click the name of the numeric variable.
Data & Statistics labels the vertical axis and plots the numeric data for
each category.
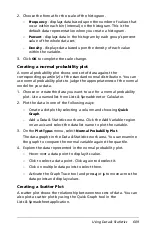
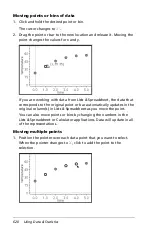
Exploring data
You can manipulate and explore plotted data.
•
Select and move points or data bins
•
Change the type of plot
•
Rescale the graph
•
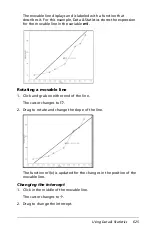
Add a movable line
•
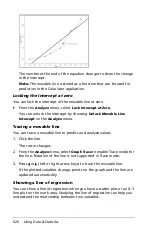
Show regression lines
•
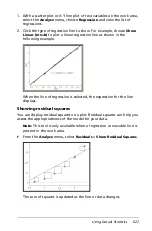
Show residual squares
•
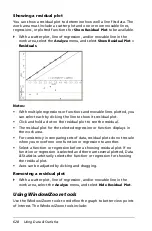
Show a residual plot
Summary of Contents for TI-Nspire
Page 38: ...26 Setting up the TI Nspire Navigator Teacher Software ...
Page 46: ...34 Getting started with the TI Nspire Navigator Teacher Software ...
Page 84: ...72 Using the Content Workspace ...
Page 180: ...168 Capturing Screens ...
Page 256: ...244 Embedding documents in web pages ...
Page 336: ...324 Polling students ...
Page 374: ...362 Using the Review Workspace ...
Page 436: ...424 Calculator ...
Page 450: ...438 Using Variables ...
Page 602: ...590 Using Lists Spreadsheet ...
Page 676: ...664 Using Notes You can also change the sample size and restart the sampling ...
Page 684: ...672 Libraries ...
Page 714: ...702 Programming ...
Page 828: ...816 Data Collection and Analysis ...
Page 846: ...834 Regulatory Information ...
Page 848: ...836 ...


