
Graphs & Geometry
493
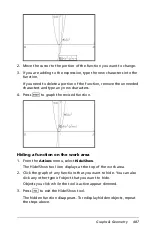
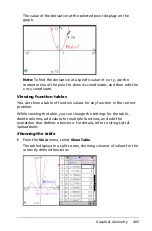
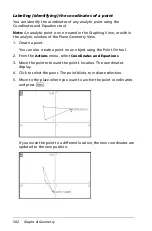
The value of the derivative at the selected point displays on the
graph.
Note:
To find the derivative at a specific value of x or y, use the
context menu of the point to show its coordinates, and then edit the
x or y coordinate.
Viewing function tables
You can show a table of function values for any function in the current
problem.
While viewing the table, you can change the settings for the table,
delete columns, add values for multiple functions, and edit the
expression that defines a function. For details, refer to
Using Lists &
Spreadsheet
.
Showing the table
`
From the
View
menu, select
Show Table
.
The table displays in a split screen, showing columns of values for the
currently defined functions.
Summary of Contents for TI-Nspire
Page 38: ...26 Setting up the TI Nspire Navigator Teacher Software ...
Page 46: ...34 Getting started with the TI Nspire Navigator Teacher Software ...
Page 84: ...72 Using the Content Workspace ...
Page 180: ...168 Capturing Screens ...
Page 256: ...244 Embedding documents in web pages ...
Page 336: ...324 Polling students ...
Page 374: ...362 Using the Review Workspace ...
Page 436: ...424 Calculator ...
Page 450: ...438 Using Variables ...
Page 602: ...590 Using Lists Spreadsheet ...
Page 676: ...664 Using Notes You can also change the sample size and restart the sampling ...
Page 684: ...672 Libraries ...
Page 714: ...702 Programming ...
Page 828: ...816 Data Collection and Analysis ...
Page 846: ...834 Regulatory Information ...
Page 848: ...836 ...


