


Using Lists & Spreadsheet
575
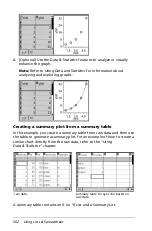
•
correlation coefficient, R.
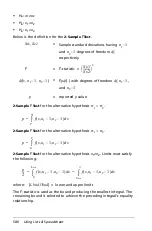
Linear Regression (mx+b) (LinRegMx)
fits the model equation
y=ax+b to the data using a least-squares fit. It displays values for
m
(slope)
and
b
(y-intercept).
Linear Regression (a+bx) (LinRegBx)
fits the model equation
y=a+bx to the data using a least-squares fit. It displays values for
a
(y-intercept),
b
(slope),
r
2
, and
r
.
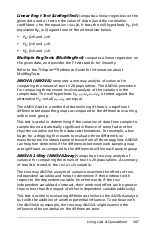
Median-Median Line (MedMed)
fits the model equation y=mx+b
to the data using the median-median line (resistant line) technique,
calculating the summary points x1, y1, x2, y2, x3, and y3.
Median-Median Line
displays values for
m
(slope) and
b
(y-intercept).
Quadratic Regression (QuadReg)
fits the second-degree
polynomial y=ax
2
+bx+c to the data. It displays values for
a
,
b
,
c
, and
R
2
.
For three data points, the equation is a polynomial fit; for four or more,
it is a polynomial regression. At least three data points are required.
Cubic Regression (CubicReg)
fits the third-degree polynomial
y=ax
3
+bx
2
+cx+d to the data. It displays values for
a
,
b
,
c
,
d
, and
R
2
. For
four points, the equation is a polynomial fit; for five or more, it is a
polynomial regression. At least four points are required.
Quartic Regression (QuartReg)
fits the fourth-degree polynomial
y=ax
4
+bx
3
+cx
2
+dx+e to the data. It displays values for
a
,
b
,
c
,
d
,
e
, and
R
2
. For five points, the equation is a polynomial fit; for six or more, it is a
polynomial regression. At least five points are required.
Power Regression (PowerReg)
fits the model equation y=axb to
the data using a least-squares fit on transformed values ln(x) and ln(y). It
displays values for
a
,
b
,
r
2
, and
r
.
Exponential Regression (ExpReg)
fits the model equation y=ab
x
to
the data using a least-squares fit on transformed values x and ln(y). It
displays values for
a
,
b
,
r
2
, and
r
.
Logarithmic Regression (LogReg)
fits the model equation
y=a+b ln(x) to the data using a least-squares fit on transformed values
ln(x) and y. It displays values for
a
,
b
,
r
2
, and
r
.
Sinusoidal Regression (SinReg)
fits the model equation
y=a sin(bx+c)+d to the data using an iterative least-squares fit. It displays
values for
a
,
b
,
c
, and
d
. At least four data points are required. At least
two data points per cycle are required in order to avoid aliased frequency
estimates.
Summary of Contents for TI-Nspire
Page 38: ...26 Setting up the TI Nspire Navigator Teacher Software ...
Page 46: ...34 Getting started with the TI Nspire Navigator Teacher Software ...
Page 84: ...72 Using the Content Workspace ...
Page 180: ...168 Capturing Screens ...
Page 256: ...244 Embedding documents in web pages ...
Page 336: ...324 Polling students ...
Page 374: ...362 Using the Review Workspace ...
Page 436: ...424 Calculator ...
Page 450: ...438 Using Variables ...
Page 602: ...590 Using Lists Spreadsheet ...
Page 676: ...664 Using Notes You can also change the sample size and restart the sampling ...
Page 684: ...672 Libraries ...
Page 714: ...702 Programming ...
Page 828: ...816 Data Collection and Analysis ...
Page 846: ...834 Regulatory Information ...
Page 848: ...836 ...


