
Data Collection and Analysis
711
.
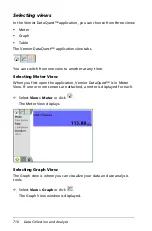
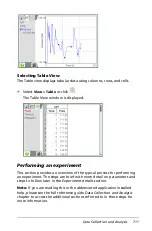
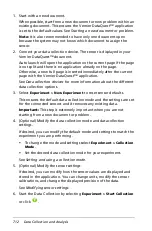
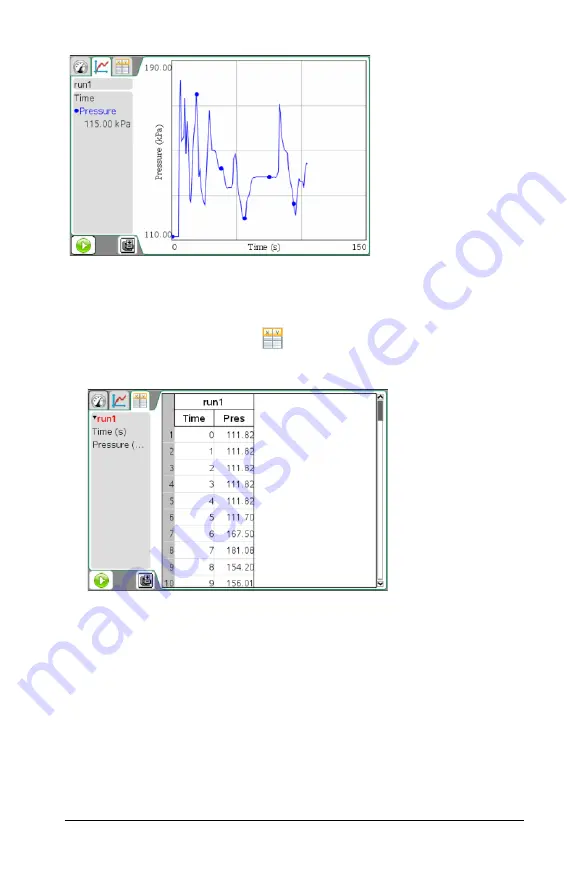
Selecting Table View
The Table view displays tabular data using columns, rows, and cells.
³
Select
View > Table
or click
.
The Table View window is displayed.
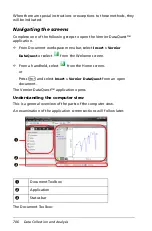
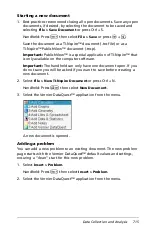
Performing an experiment
This section provides an overview of the typical process for performing
an experiment. The steps are brief with more detail on parameters and
steps to follow later in the
Experiment details
section.
Note:
If you are reading this in the abbreviated application installed
help, please see the full reference guide
Data Collection and Analysis
chapter to access the additional sections referred to in these steps for
more information.
Summary of Contents for TI-Nspire
Page 38: ...26 Setting up the TI Nspire Navigator Teacher Software ...
Page 46: ...34 Getting started with the TI Nspire Navigator Teacher Software ...
Page 84: ...72 Using the Content Workspace ...
Page 180: ...168 Capturing Screens ...
Page 256: ...244 Embedding documents in web pages ...
Page 336: ...324 Polling students ...
Page 374: ...362 Using the Review Workspace ...
Page 436: ...424 Calculator ...
Page 450: ...438 Using Variables ...
Page 602: ...590 Using Lists Spreadsheet ...
Page 676: ...664 Using Notes You can also change the sample size and restart the sampling ...
Page 684: ...672 Libraries ...
Page 714: ...702 Programming ...
Page 828: ...816 Data Collection and Analysis ...
Page 846: ...834 Regulatory Information ...
Page 848: ...836 ...


