
Using Data & Statistics
609
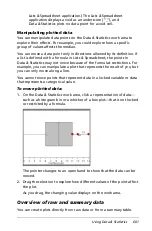
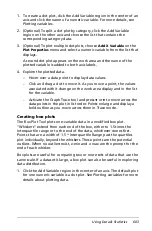
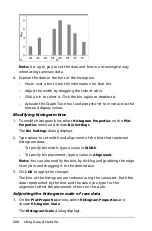
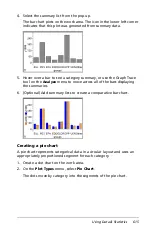
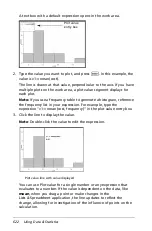
2. Choose the format for the scale of the histogram.
–
Frequency
- displays data based upon the number of values that
occur within each bin (interval) on the histogram. This is the
default data representation when you create a histogram.
–
Percent
- displays data in the histogram by each group’s percent
value of the whole data set.
–
Density
- displays data based upon the density of each value
within the variable.
3. Click
OK
to complete the scale change.
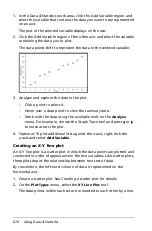
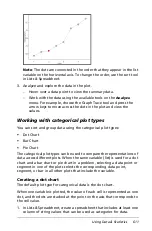
Creating a normal probability plot
A normal probability plot shows one set of data against the
corresponding quartile (
z
) of the standard normal distribution. You can
use normal probability plots to judge the appropriateness of the normal
model for your data.
1. Choose or create the data you want to use for a normal probability
plot. Use a named list from Lists & Spreadsheet or Calculator.
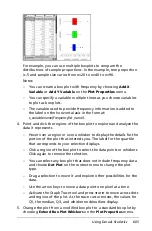
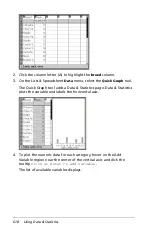
2. Plot the data in one of the following ways:
–
Create a dot plot by selecting a column and choosing
Quick
Graph
.
–
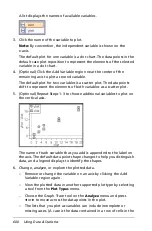
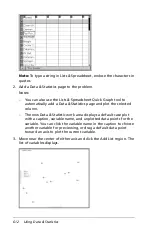
Add a Data & Statistics work area. Click the Add Variable region
on an axis and select the data list name to plot the variable.
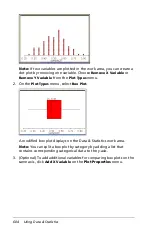
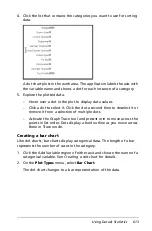
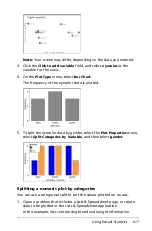
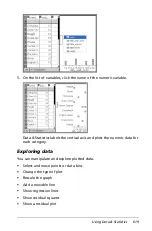
3. On the
Plot Types
menu, select
Normal Probability Plot
.
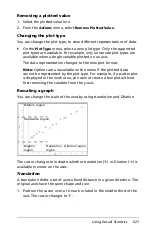
The data graphs in the Data & Statistics work area. You can examine
the graph to compare the normal variable against the quartile.
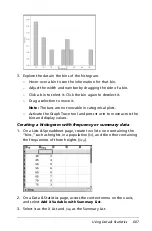
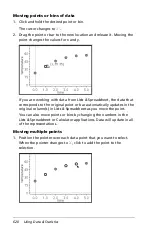
4. Explore the data represented in the normal probability plot.
–
Hover over a data point to display its value.
–
Click to select a data point. Click again to deselect it.
–
Click on multiple data points to select them.
–
Activate the Graph Trace tool and press
¡
or
¢
to move across the
data points and display values.
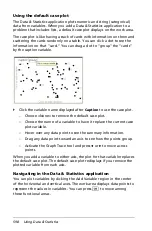
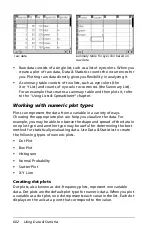
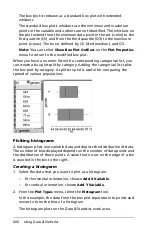
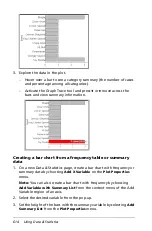
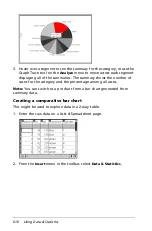
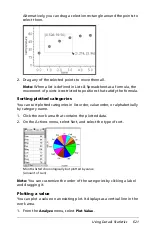
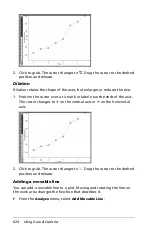
Creating a Scatter Plot
A scatter plot shows the relationship between two sets of data. You can
also plot a scatter plot by using the Quick Graph tool in the
Lists & Spreadsheet application.
Summary of Contents for TI-Nspire
Page 38: ...26 Setting up the TI Nspire Navigator Teacher Software ...
Page 46: ...34 Getting started with the TI Nspire Navigator Teacher Software ...
Page 84: ...72 Using the Content Workspace ...
Page 180: ...168 Capturing Screens ...
Page 256: ...244 Embedding documents in web pages ...
Page 336: ...324 Polling students ...
Page 374: ...362 Using the Review Workspace ...
Page 436: ...424 Calculator ...
Page 450: ...438 Using Variables ...
Page 602: ...590 Using Lists Spreadsheet ...
Page 676: ...664 Using Notes You can also change the sample size and restart the sampling ...
Page 684: ...672 Libraries ...
Page 714: ...702 Programming ...
Page 828: ...816 Data Collection and Analysis ...
Page 846: ...834 Regulatory Information ...
Page 848: ...836 ...