


Tools for Viewing Data
107
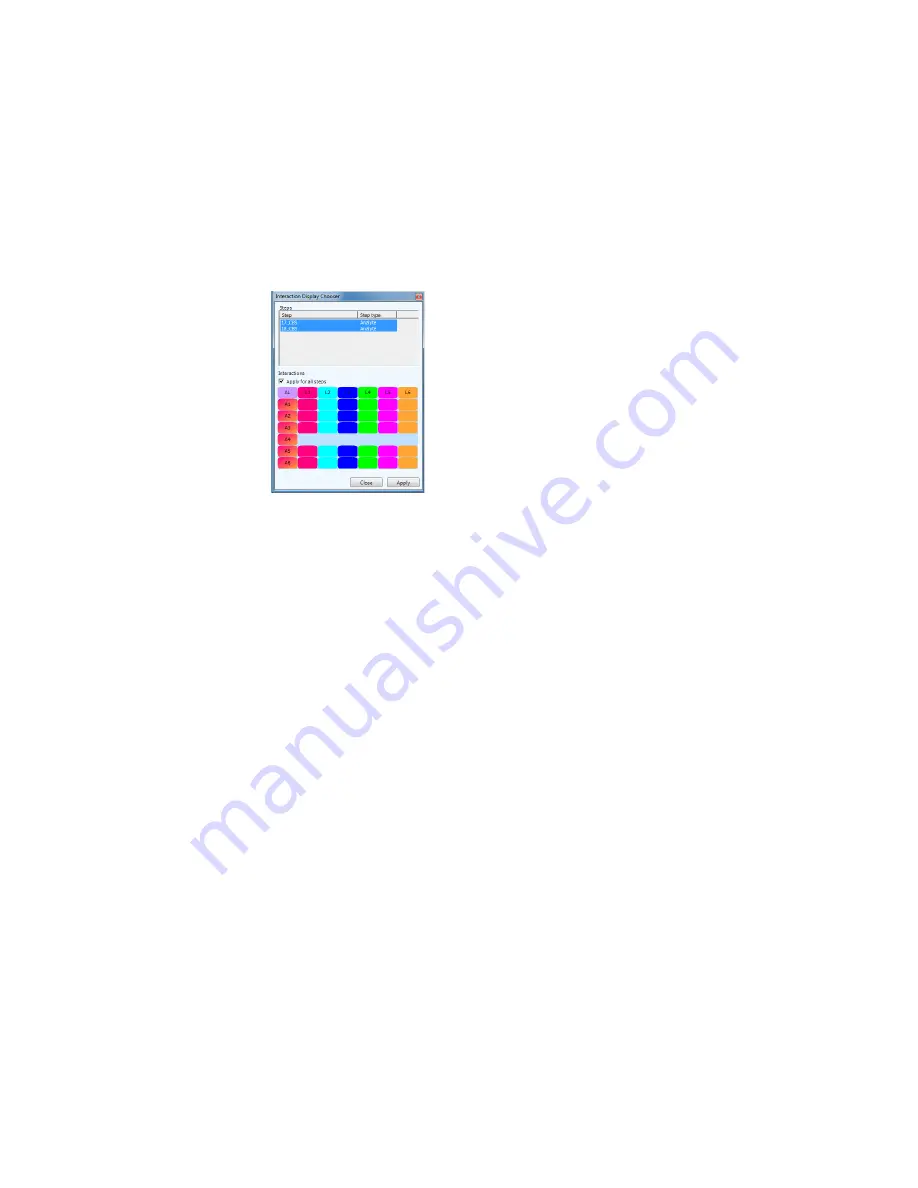
Interaction Display Options
Interaction options control the display of interaction data and whether or not
to select sensorgrams for processing and analysis.
To open the Interaction Display Chooser:
•
Click Interaction in the Data tab
D
ISPLAY
C
ONTROL
G
RID
The Display control grid represents the available interaction between the
analytes (one analyte per row) and ligands (one ligand per column) in an
experiment based on the protocol steps selected in the Steps list.
Each square represents one interaction spot and is color coded to match the
corresponding sensorgram in the data windows.
To change the interaction view state:
•
Click an interaction in the grid to change its state from visible to
hidden
To change the display state for an entire row or column:
•
Click the row or column header
To change the display state for the entire grid:
1. Click the letters AL (Analyte-Ligand).
2. Do one of the following:
Summary of Contents for XPR36
Page 1: ...ProteOn XPR36 Protein Interaction Array System Protein Interaction Analysis User Manual...
Page 2: ......
Page 3: ...ProteOn XPR36 Protein Interaction Array System Version 3 1 User Manual...
Page 4: ......
Page 10: ...ProteOn XPR36 System viii...
Page 166: ...ProteOn XPR36 System Analysis 148...
Page 188: ...ProteOn XPR36 Maintenance 170...
Page 194: ...ProteOn XPR36 System ProteOn System Troubleshooting 176...
Page 226: ...ProteOn XPR36 System A ProteOn XPR36 Instrument and Peripherals 208...
Page 250: ...ProteOn XPR36 System E Ordering Information 232...
Page 264: ...ProteOn XPR36 System F Security Edition Configuration Guide 246...
Page 276: ...ProteOn XPR36 System Glossary 258...
Page 287: ......


