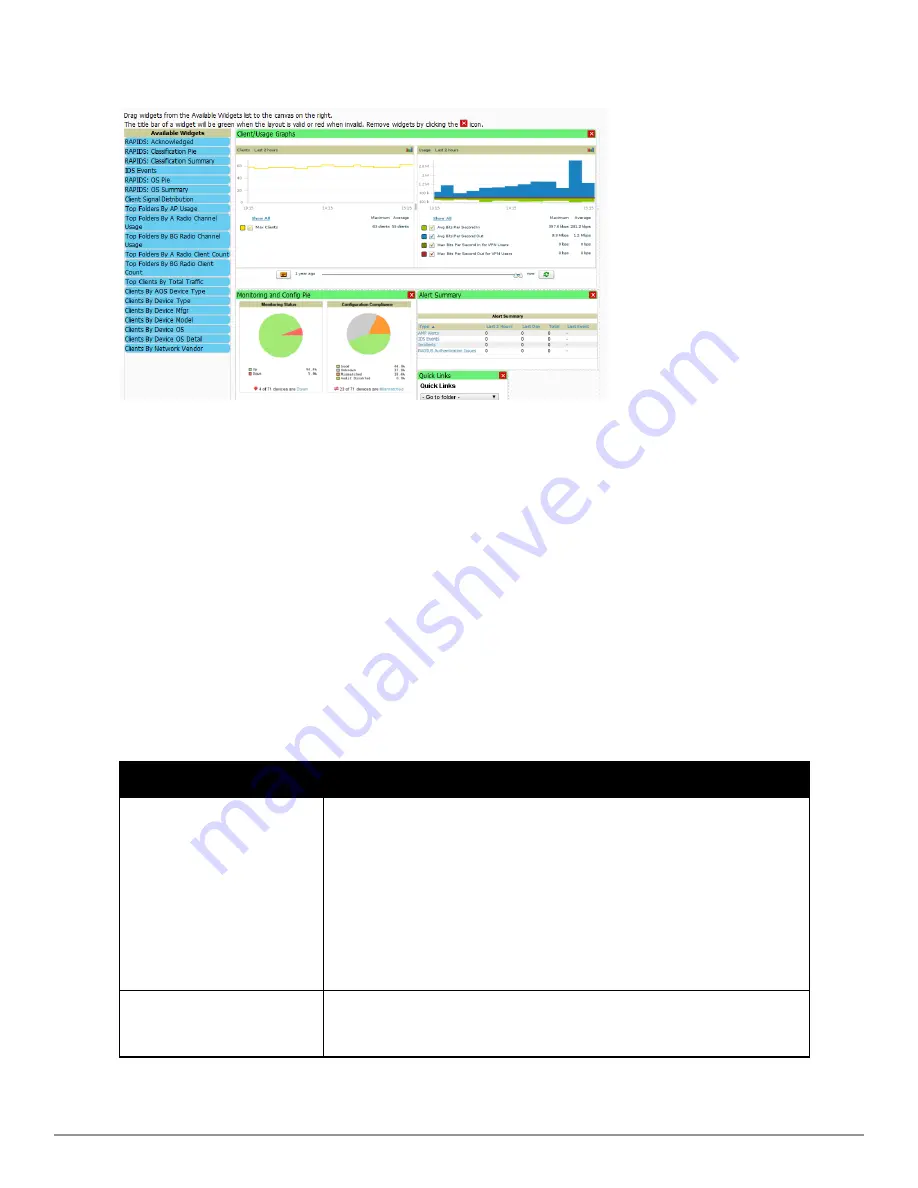
Figure 11:
Customize Overview
Page
Adding Widgets
The
Available Widgets
section on the left holds all available graphical elements (widgets). Select any blue widget tile
with a verbal description enclosed, and it immediately turns into a graphical element with a description.
Drag the widgets you want to appear on the
Home > Overview
dashboard across to the gridlines and arrange them
in the right section, within the gridlines. A widget snaps back to the nearest available gridline if you drop it across
two or more lines and turns red if you attempt to place it over gridlines already occupied by widgets. Widgets with a
green top banner are properly placed and set to appear when you select
Save
. Widgets that remain in the left section
will not appear; although they can be reinstated by selecting
Restore Defaults
.
Available Widgets
Table 2
describes the list of available widgets along with a description for each. Note that when a widget is enabled,
the information that displays can vary based on the user’s permission level. Certain roles, for example, limit the top
folder that a user can view.
Widget
Description
Client/Usage Graphs
The
Client
graph is enabled by default and, by default, shows the maximum number of
attached clients over the last two hours. Select the
Show All
link to view more
specific client information on the graph, such as the total and average clients for a
specific SSID, the maximum VPN sessions, etc. The available check boxes within this
graph are determined by the SSIDs that AirWave is aware of from polling the device.
The
Usage
graph is enabled by default and, by default, shows the average bits-per-
second in/out information and average VPN in/out information. Select the
Show All
link to view usage information for specific SSIDs. The available checkboxes within
this graph are determined by by the SSIDs that AirWave is aware of from polling the
device.
The information in these graphs is color coded to match the selected check boxes.
Monitoring and Config Pie
The
Monitoring Status
pie shows the percentage of total devices that are up and the
number and perctentage of devices that are currently down. Clicking within this pie
chart takes you to the
APs/Devices > Down
page.
Table 2:
Available Widgets
Dell PowerConnect W-AirWave 7.6 | User Guide
Configuring AirWave | 11
Содержание PowerConnect W-AirWave 7.6
Страница 1: ...Dell PowerConnect W AirWave 7 6 User Guide ...
Страница 12: ...xii Dell PowerConnect W AirWave 7 6 User Guide ...
Страница 112: ...100 Configuring and Using Device Groups Dell PowerConnect W AirWave 7 6 User Guide ...
Страница 162: ...150 Discovering Adding and Managing Devices Dell PowerConnect W AirWave 7 6 User Guide ...
Страница 198: ...186 Using RAPIDS and Rogue Classification Dell PowerConnect W AirWave 7 6 User Guide ...
Страница 276: ...264 Creating Running and Emailing Reports Dell PowerConnect W AirWave 7 6 User Guide ...
Страница 324: ...312 Using VisualRF Dell PowerConnect W AirWave 7 6 User Guide ...
Страница 332: ...320 Index Dell PowerConnect W AirWave 7 6 User Guide ...


