


Creating and Editing Control Objects
SECTION 4 Objects
63
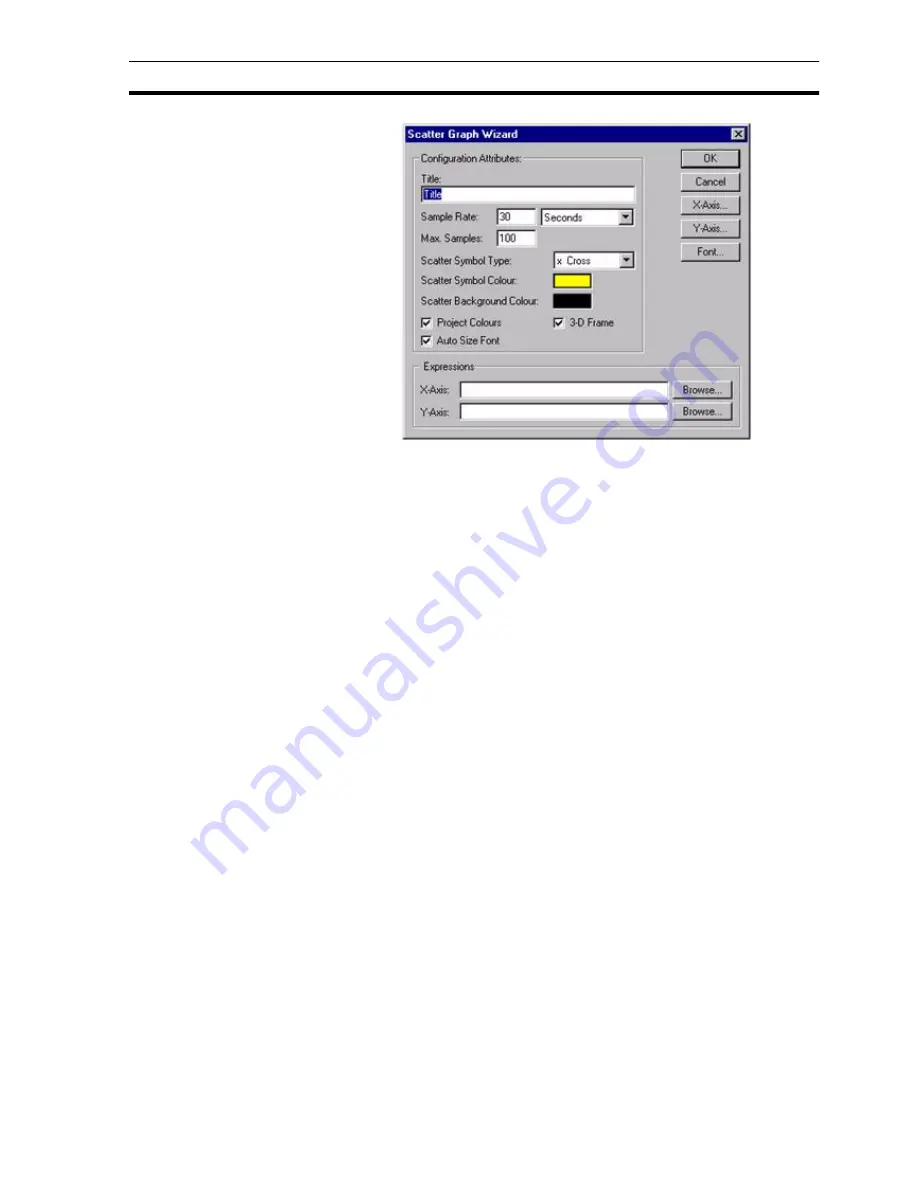
The Wizard allows entry in the Configuration Attributes: and Expressions
fields.
1, 2, 3…
1. Enter the frequency of data sampling in the Sample Rate: field; in this
example the sample rate is every thirty seconds.
2. Enter the maximum number of samples to be displayed on the scatter
graph in the Max Samples: field.
3. Select the type of symbol to represent the data.
4. Select the colour of the symbol representing the data.
5. Select the colour of the scatter graph background.
6. Toggle the Project Colours and 3-D Frame settings as desired. If set, the
Project Colours field allows the colour of the axis to be changed using the
Palette. The 3-D Frame option enables the graph to appear with a 3-D
frame.
7. Either enter an arithmetic expression for the X and Y axis or select one
through the Browse button. An expression point can also be associated
with the Scatter Graph Wizard by dragging a point directly from the Point
Editor. Refer to chapter 3, Points regarding adding a new point and
dragging from the Point Editor.
8. Change the fonts used for the Scatter Graph via the Font button. The font
size used by the graph can be automatically calculated for the user by
selecting the Auto Size Font field.
9. Exit the Scatter Graph Wizard by clicking the OK button to accept the new
scatter graph attributes or click the Cancel button to leave the scatter
graph unchanged.
To configure the X axis, click the X-Axis button. To configure the Y-axis , click
the Y-Axis button. The Axis Scaling dialog box opens:
Summary of Contents for CX-Supervisor
Page 1: ...CX Supervisor Software Cat No W10E EN 01 User Manual Software Release 3 1...
Page 3: ...Copyright Notice 2...
Page 16: ...15...
Page 17: ...16...
Page 27: ...Tip of the Day SECTION 1 Graphics Editor 26...
Page 35: ...CX Supervisor Preferences SECTION 2 Pages 34...
Page 79: ...Responding to Events SECTION 5 ActiveX Objects 78...
Page 115: ...Printing the Graphics Library SECTION 7 Graphics Library 114...
Page 181: ...Data Logging SECTION 11 Data Logging 180...
Page 201: ...Examples SECTION 12 Databases 200...
Page 243: ...Performance Monitor SECTION 16 Application Analysis Performance Monitor 242...
Page 253: ...Using with Omron s CX Server OPC SECTION 17 Using CX Supervisor as an OPC Cli 252...
Page 259: ...Creating a CX Supervisor Client application SECTION 18 Connecting to a remote CX 258...
Page 263: ...Adding a Point Linked to a Parameter SECTION 19 Connecting to Omron Industrial 262...
Page 271: ...Data Logging SECTION 20 Best Practices 270...
Page 275: ...Configuring a Server PC running Windows NT or 2000 Appendix A Configuring a PC 274...
Page 277: ...Appendix B Frequently Asked Questions 276...
Page 296: ...Appendix B Frequently Asked Questions 295...
Page 297: ...Appendix B Frequently Asked Questions 296...
Page 298: ...Appendix B Frequently Asked Questions 297...
Page 299: ...Appendix B Frequently Asked Questions 298...
Page 333: ...Revision history 332...


