3D Mapping Function
E-29
•
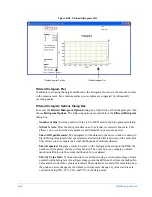
To obtain a more detailed listing of the histogram data and Q value statistics, click the right
mouse button on the histogram. Select
Print Table
to print two histogram data tables: one
based on the point distribution, and one based on the Q value distribution. The Q value
distribution can be listed in terms of percent (if the Q Value Table by Percent option is
selected) or in terms of peak-to-valley.
•
Print Q Value Table by Percent:
If this option is selected, the Q value distribution printed
with the
Print Table
option described above is listed by percentage (in increments of 5%)
for 5% to 100% of the data points. If this option is not selected, the Q value distribution is
listed by peak-to-valley increments.
•
Log Scale:
If selected, this option displays logarithmic units along the Y-axis of the plot.
•
Set as Default:
Check this box to define the current options settings as the default settings.
Any subsequent filtered histogram measurement will be analyzed using these settings.
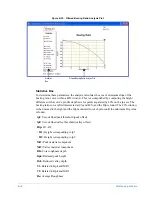
Filtered Histogram Plot Box
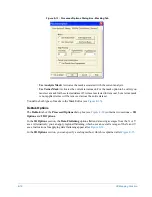
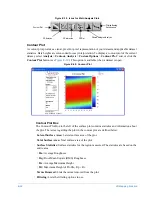
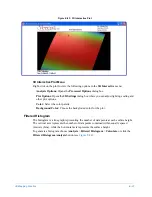
The Contour Plot Box to the left of the surface plot contains the following statistics and
parameters about the plot:
•
Roughness:
Roughness statistics for the region measured. The statistics are based on the
entire area.
•
Ra:
Average Roughness
•
Rq:
Root Mean Square (RMS) Roughness
•
Rz:
Average Maximum Height
•
Rt:
Maximum Height of Profile, Rp + Rv
•
Terms Removed:
Lists the terms removed from the plot.
•
Filtering:
Lists the filtering options in use.
Filtered Bearing Ratio Analysis Plot
The bearing ratio curve (also called material ratio curve) is a graphical representation of the tp
(bearing ratio) parameter in relation to the profile level (see
). This curve contains all of
the amplitude information of a profile.
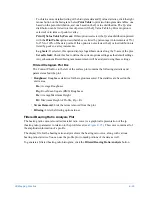
The display file for the bearing ratio analysis shows the bearing ratio curve, along with various
bearing ratio statistics. You can use the profile plot to mask portions of the data as well.
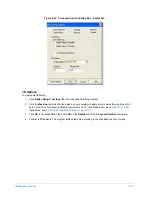
To generate a filtered bearing ratio histogram, click the
Filtered Bearing Ratio Analysis
button.
Содержание Dektak 150
Страница 1: ......
Страница 2: ...P N 980 294 Standard P N 980 298 Cleanroom Revision A DEKTAK 150 SURFACE PROFILER USER S MANUAL ...
Страница 7: ......
Страница 17: ......
Страница 81: ......
Страница 105: ......
Страница 149: ......
Страница 191: ......
Страница 251: ......
Страница 257: ...A 6 Facilities Specifications Figure A 6 Dektak 150 without Enclosure Side View ...
Страница 258: ...Facilities Specifications A 7 Figure A 7 Dektak 150 Dimensions without Enclosure Top View ...
Страница 259: ...A 8 Facilities Specifications Figure A 8 Dektak 150 without Enclosure Center of Mass ...
Страница 273: ......
Страница 283: ......
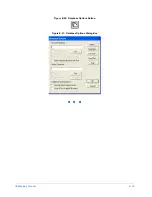
Страница 320: ...3D Mapping Function E 37 Figure E 26 Database Options Button Figure E 27 Database Options Dialog Box ...
Страница 321: ......
Страница 331: ......
Страница 333: ......
Страница 336: ......
Страница 337: ......
Страница 349: ......


