3D Mapping Function
E-25
2D Analysis Plot Cursors
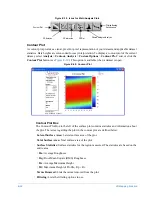
On the 2D Analysis plots, set these cursors at the points of interest by clicking and dragging
them to position (see
). The statistics to the right of the X and Y profile plots refer
to the area between the cursors. The X and Y distance between the two points are shown
above and to the right of the plot.
You can expand the width of each cursor by clicking and dragging the arrows at its base.
When expanded, the height of the cursor is the average height over the cursor region.
When you have selected the Multiple Crosshairs cursor type, you may have several traces on
the profile plots, each of which can have associated cursors. Only the cursors for the
currently active trace are shown. To show statistics for the different traces, you can click on
the trace, or right-click on the profile plot and select
Next Trace
or
Previous Trace
.
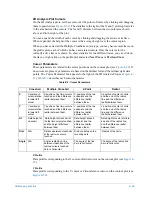
Cursor Parameters
These parameters are related to the cursor positions on the contour plot (see
). If
no cursors are present, parameters are based on the farthest left and the farthest right data
points. The Cursor Parameter box appears to the right of the 2D Analysis Plot (see
describes each cursor parameter.
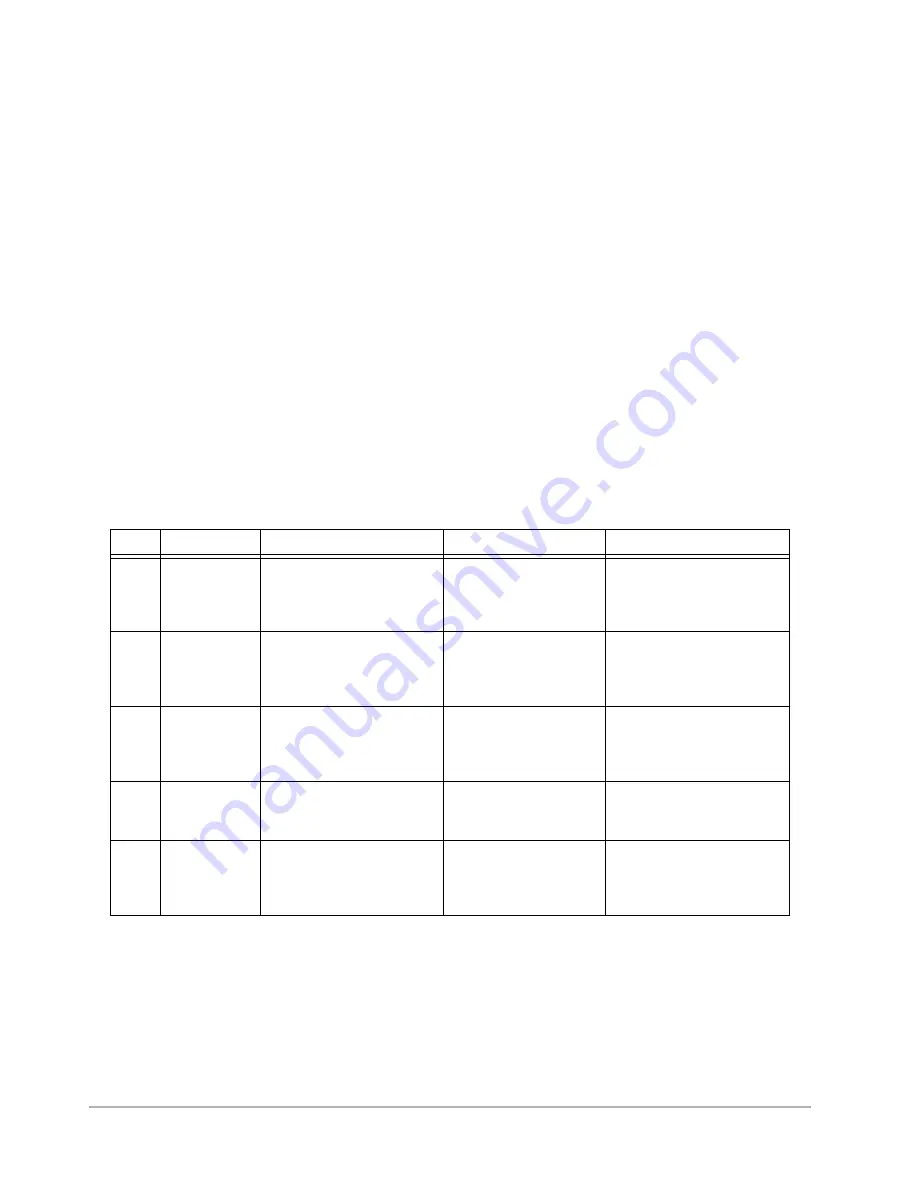
Table E-3: Cursor Parameters
X Profile
Data profile corresponding to the X cursor or Radial cursor on the contour plot (see
).
Y Profile
Data profile corresponding to the Y cursor or Circumference cursor on the contour plot (see
).
Crosshair
Multiple Crosshair
2-Point
Radial
X
X position of
cursor relative
to lower left
corner.
X position of last two cursors
touched, and the difference
(delta) between them.
X positions of the two
endpoints and the
difference (delta)
between them.
X position of center of circle
and the end of the radius
line, and the difference
(delta) between them.
Y
Y position of
cursor relative
to lower left
corner.
Y position of last two cursors
touched, and the difference
(delta) between them.
Y positions of the two
endpoints and the
difference (delta)
between them.
Y position of center of circle
and the end of the radius
line, and the difference
(delta) between them.
Ht.
Data height at
crosshair
Data height at crosshair of
the last two cursors touched,
and the height difference
between them.
Data height at each
endpoint and the
difference (delta)
between them.
Data height at center of circle
and end of the radius line,
and the difference (delta)
between them.
Dist
N/A
Distance between crosshairs
of the last two cursors
touched.
Distance between the
two endpoints.
Radius of the circle.
Angle
N/A
Angle created by a line
between crosshairs of the
last two cursors touched.
Zero is horizontal.
The angle of the line.
Zero is horizontal.
The angle of the radius line.
Zero is horizontal.
Содержание Dektak 150
Страница 1: ......
Страница 2: ...P N 980 294 Standard P N 980 298 Cleanroom Revision A DEKTAK 150 SURFACE PROFILER USER S MANUAL ...
Страница 7: ......
Страница 17: ......
Страница 81: ......
Страница 105: ......
Страница 149: ......
Страница 191: ......
Страница 251: ......
Страница 257: ...A 6 Facilities Specifications Figure A 6 Dektak 150 without Enclosure Side View ...
Страница 258: ...Facilities Specifications A 7 Figure A 7 Dektak 150 Dimensions without Enclosure Top View ...
Страница 259: ...A 8 Facilities Specifications Figure A 8 Dektak 150 without Enclosure Center of Mass ...
Страница 273: ......
Страница 283: ......
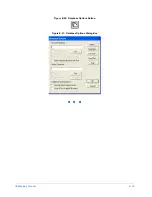
Страница 320: ...3D Mapping Function E 37 Figure E 26 Database Options Button Figure E 27 Database Options Dialog Box ...
Страница 321: ......
Страница 331: ......
Страница 333: ......
Страница 336: ......
Страница 337: ......
Страница 349: ......

