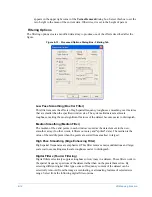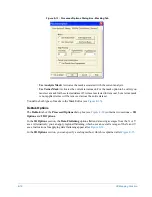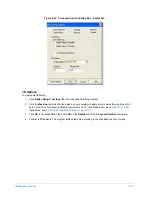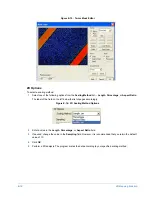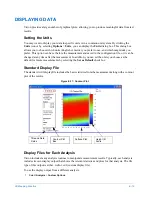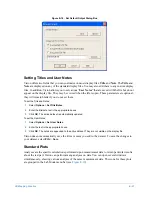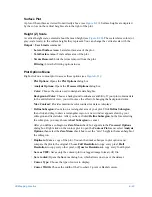
3D Mapping Function
E-27
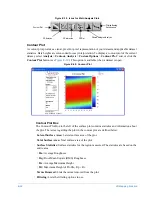
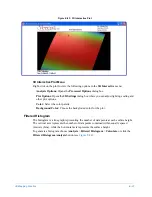
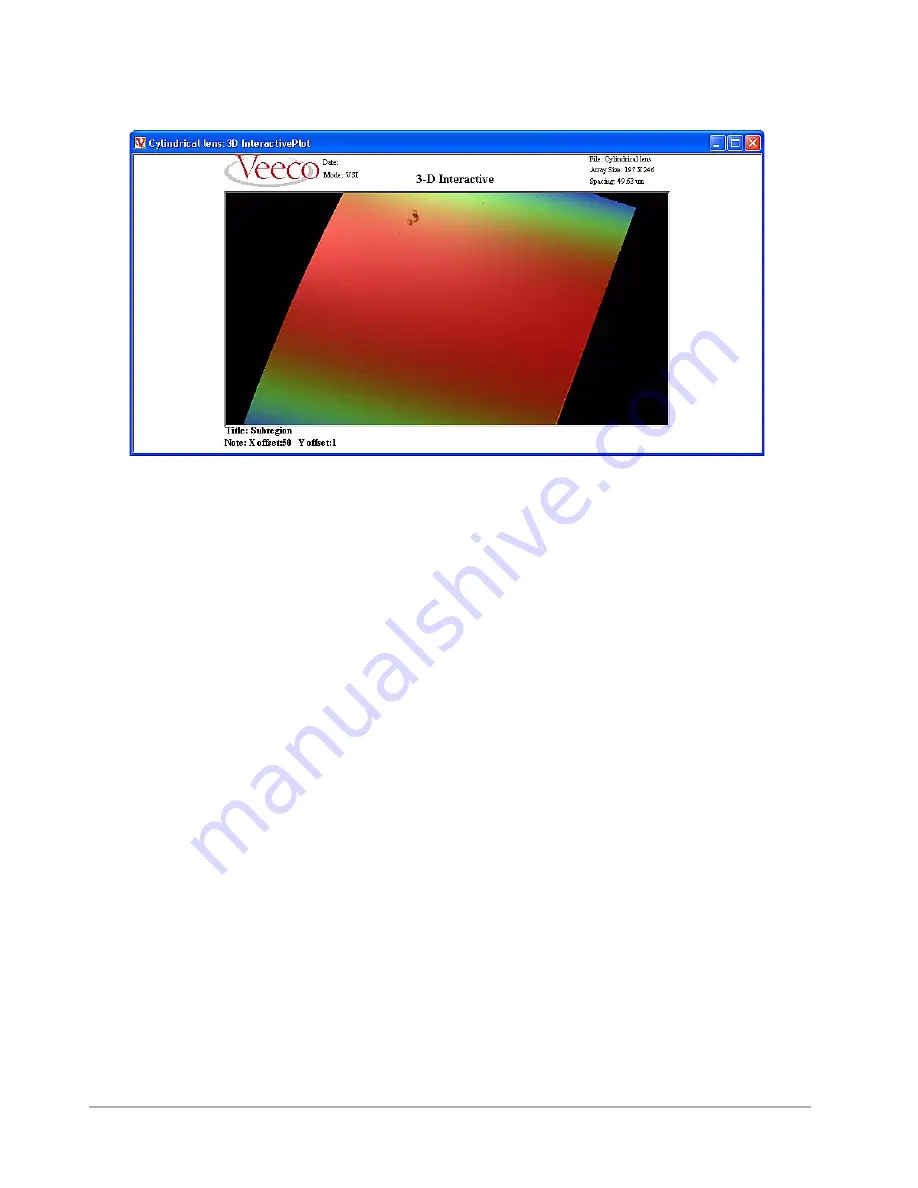
Figure E-23: 3D Interactive Plot
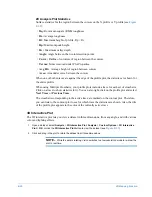
3D Interactive Plot Menu
Right-click on the plot to view the following options in the
3D Interactive
menu:
•
Analysis Options:
Opens the
Processed Options
dialog box.
•
Plot Options:
Opens the
3D Settings
dialog box where you can adjust lighting, scaling and
other plot options.
•
Color:
Select the color palette.
•
Background Color:
Choose the background color for the plot.
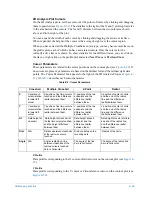
Filtered Histogram
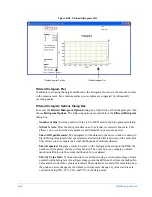
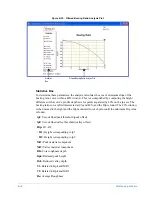
The histogram is a line graph representing the number of data points at each surface height.
The vertical axis represents the number of data points contained within equally spaced
intervals (bins), while the horizontal axis represents the surface height.
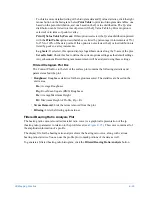
To generate a histogram choose
Analysis
>
Filtered Histogram
>
Calculate
, or click the
Filtered Histogram Analysis
button (see
Содержание Dektak 150
Страница 1: ......
Страница 2: ...P N 980 294 Standard P N 980 298 Cleanroom Revision A DEKTAK 150 SURFACE PROFILER USER S MANUAL ...
Страница 7: ......
Страница 17: ......
Страница 81: ......
Страница 105: ......
Страница 149: ......
Страница 191: ......
Страница 251: ......
Страница 257: ...A 6 Facilities Specifications Figure A 6 Dektak 150 without Enclosure Side View ...
Страница 258: ...Facilities Specifications A 7 Figure A 7 Dektak 150 Dimensions without Enclosure Top View ...
Страница 259: ...A 8 Facilities Specifications Figure A 8 Dektak 150 without Enclosure Center of Mass ...
Страница 273: ......
Страница 283: ......
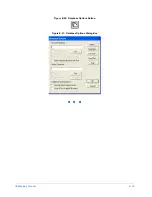
Страница 320: ...3D Mapping Function E 37 Figure E 26 Database Options Button Figure E 27 Database Options Dialog Box ...
Страница 321: ......
Страница 331: ......
Страница 333: ......
Страница 336: ......
Страница 337: ......
Страница 349: ......


