E-28
3D Mapping Function
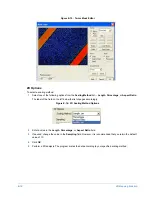
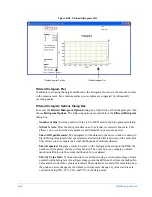
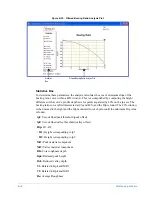
Figure E-24: Filtered Histogram Plot
Filtered Histogram Plot
In addition to showing the height distribution, the histogram also shows the amount of noise
in the measurement. For a random surface, noise spikes are suggested by infrequently
occurring peaks.
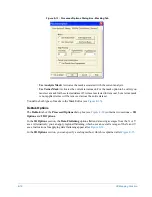
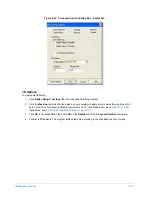
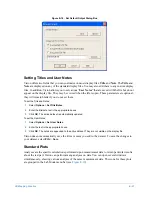
Filtered Histogram Options Dialog Box
To access the
Filtered Histogram
Options
dialog box, right-click on the histogram plot then
choose
Histogram Options.
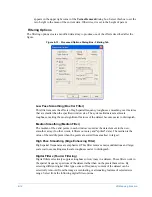
The following options are available in the
Filtered Histogram
dialog box:
•
Number of bins:
Sets the number of bins (10 to 5000) used in the histogram calculation.
•
Mirror X Axis:
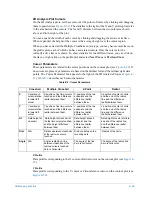
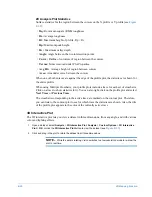
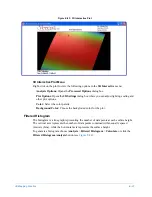
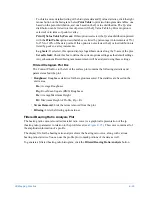
Plots the histogram data on an X axis that is centered about zero. This
allows you to see how the data points are distributed about a zero mean level.
•
Show All Open Datasets:
The histogram for the dataset in the active window is drawn in
black. Histograms for all other open datasets are drawn in different colors on the same plot.
This allows you to compare the actual distributions of multiple datasets.
•
Show Gaussian:
Displays a Gaussian curve on the histogram, based upon the RMS, the
number of data points, and the current bin size. The curve lets you compare a normal,
random distribution to the actual distribution of your dataset.
•
Show Q Value Stats:
Q value statistics are calculated using a certain percentage of data
points from the histogram. At each percentage point, the difference between the highest bin
value and the lowest bin value is calculated. These statistics are useful for examining how
the peak-to-valley changes as the number of data points changes. Q value statistics are
calculated using 80%, 85%, 90%, and 95% of the data points.
Filtered Histogram Plot
Filtered Histogram Plot Box
Содержание Dektak 150
Страница 1: ......
Страница 2: ...P N 980 294 Standard P N 980 298 Cleanroom Revision A DEKTAK 150 SURFACE PROFILER USER S MANUAL ...
Страница 7: ......
Страница 17: ......
Страница 81: ......
Страница 105: ......
Страница 149: ......
Страница 191: ......
Страница 251: ......
Страница 257: ...A 6 Facilities Specifications Figure A 6 Dektak 150 without Enclosure Side View ...
Страница 258: ...Facilities Specifications A 7 Figure A 7 Dektak 150 Dimensions without Enclosure Top View ...
Страница 259: ...A 8 Facilities Specifications Figure A 8 Dektak 150 without Enclosure Center of Mass ...
Страница 273: ......
Страница 283: ......
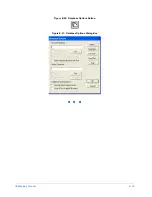
Страница 320: ...3D Mapping Function E 37 Figure E 26 Database Options Button Figure E 27 Database Options Dialog Box ...
Страница 321: ......
Страница 331: ......
Страница 333: ......
Страница 336: ......
Страница 337: ......
Страница 349: ......

