


Creating and Editing Control Objects
SECTION 4 Objects
67
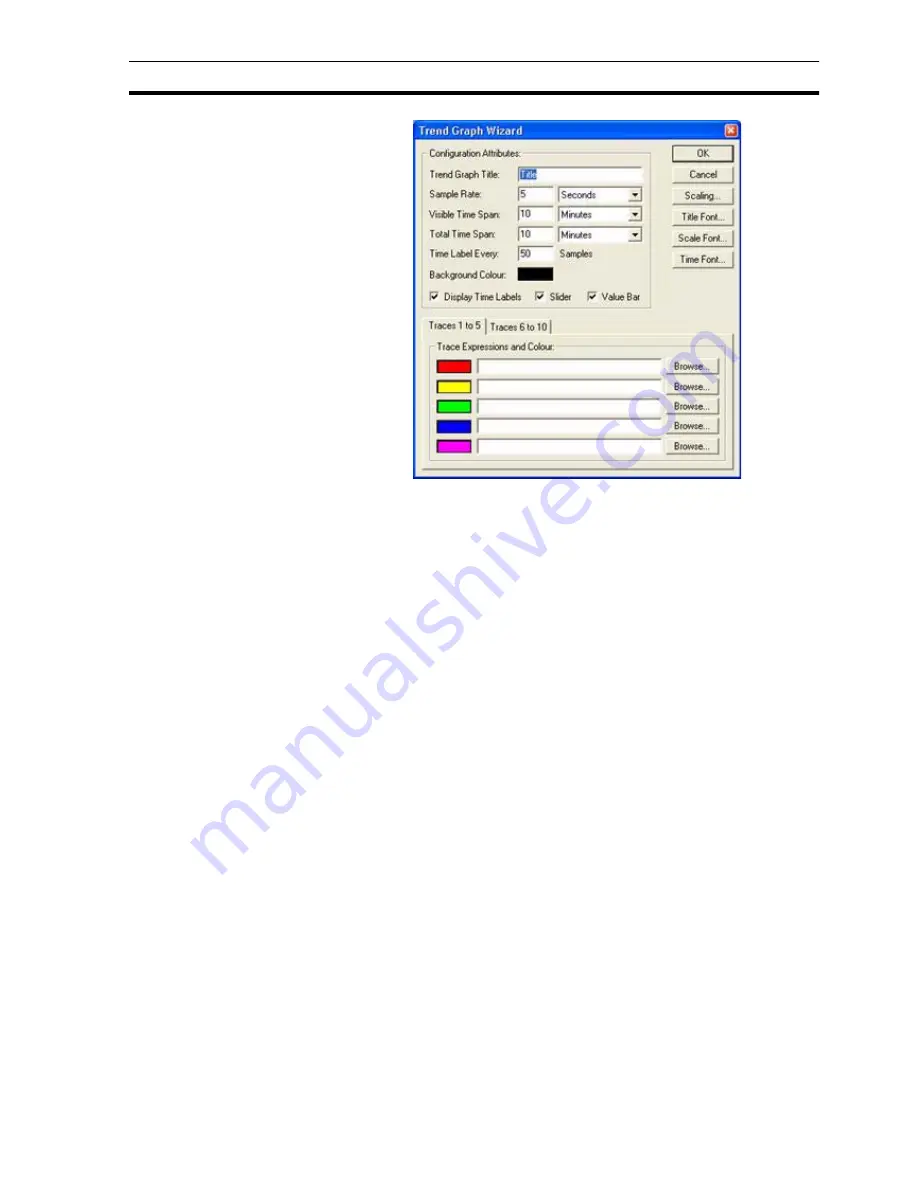
The Wizard allows entry of Configuration Attributes: and assignment of line
colours and expressions.
1, 2, 3…
1. Enter a title for the graph in the Trend Graph Title: field.
2. Enter the frequency of data sampling in the Sample Rate: field, in this
example it is every five seconds.
3. Enter the period displayed by the graph at any one time in the Visible Time
Span: field.
4. Enter the size of buffer for stored data of samples in the Total Time Span:
field.
5. Enter the number of samples on the X-axis in the Time Label Every: field.
6. Click the background colour and select the required colour from the
palette.
7. Toggle the Display Time Labels, Display Slider and Value Bar settings as
desired. Enabling the Value Bar allows the graph to be clicked during
runtime to display the data value at that point.
8. Enter an arithmetic trace expression for each point or select an expression
via a Browse button. An existing point can also be associated with the
Wizard by dragging the point directly from the Point Editor. See chapter 3,
Points regarding adding a new point and dragging from the Point Editor.
9. Change the fonts used for the Graph Title, Scale and Time axis via the
appropriate font button. Alternatively, font sizes can be automatically
calculated by selecting the Auto Font Size option.
10.Exit the Wizard by clicking the OK button to accept the new Trend Graph
attributes, or click Cancel to leave the Trend Graph unchanged.
The units of measurement of time are selected from the associated field.
To select graph scaling, click the Scaling button; the Trend Graph Scaling
dialog box opens:
Содержание CX-Supervisor
Страница 1: ...CX Supervisor Software Cat No W10E EN 01 User Manual Software Release 3 1...
Страница 3: ...Copyright Notice 2...
Страница 16: ...15...
Страница 17: ...16...
Страница 27: ...Tip of the Day SECTION 1 Graphics Editor 26...
Страница 35: ...CX Supervisor Preferences SECTION 2 Pages 34...
Страница 79: ...Responding to Events SECTION 5 ActiveX Objects 78...
Страница 115: ...Printing the Graphics Library SECTION 7 Graphics Library 114...
Страница 181: ...Data Logging SECTION 11 Data Logging 180...
Страница 201: ...Examples SECTION 12 Databases 200...
Страница 243: ...Performance Monitor SECTION 16 Application Analysis Performance Monitor 242...
Страница 253: ...Using with Omron s CX Server OPC SECTION 17 Using CX Supervisor as an OPC Cli 252...
Страница 259: ...Creating a CX Supervisor Client application SECTION 18 Connecting to a remote CX 258...
Страница 263: ...Adding a Point Linked to a Parameter SECTION 19 Connecting to Omron Industrial 262...
Страница 271: ...Data Logging SECTION 20 Best Practices 270...
Страница 275: ...Configuring a Server PC running Windows NT or 2000 Appendix A Configuring a PC 274...
Страница 277: ...Appendix B Frequently Asked Questions 276...
Страница 296: ...Appendix B Frequently Asked Questions 295...
Страница 297: ...Appendix B Frequently Asked Questions 296...
Страница 298: ...Appendix B Frequently Asked Questions 297...
Страница 299: ...Appendix B Frequently Asked Questions 298...
Страница 333: ...Revision history 332...


