


S e n d d o c u m e n t a t i o n c o m m e n t s t o m d s f e e d b a c k - d o c @ c i s c o . c o m
B-14
Cisco MDS 9000 Family Troubleshooting Guide, Release 3.x
OL-9285-05
Appendix B Troubleshooting Tools and Methodology
Using Cisco MDS 9000 Family Tools
Fabric Manager and Device Manager
Fabric Manager provides a map of the discovered fabric and includes tables that display statistical
information about the switches in the fabric. You can also select troubleshooting tools from the Fabric
Manager Tools menu.
Note
When you click on a zone or VSAN in Fabric Manager, the members of the zone or VSAN are
highlighted on the Fabric Manager Map pane.
Device Manager provides a graphic display of a specific switch and shows the status of each port on the
switch. From Device Manager, you can drill down to get detailed statistics about a specific switch or
port.
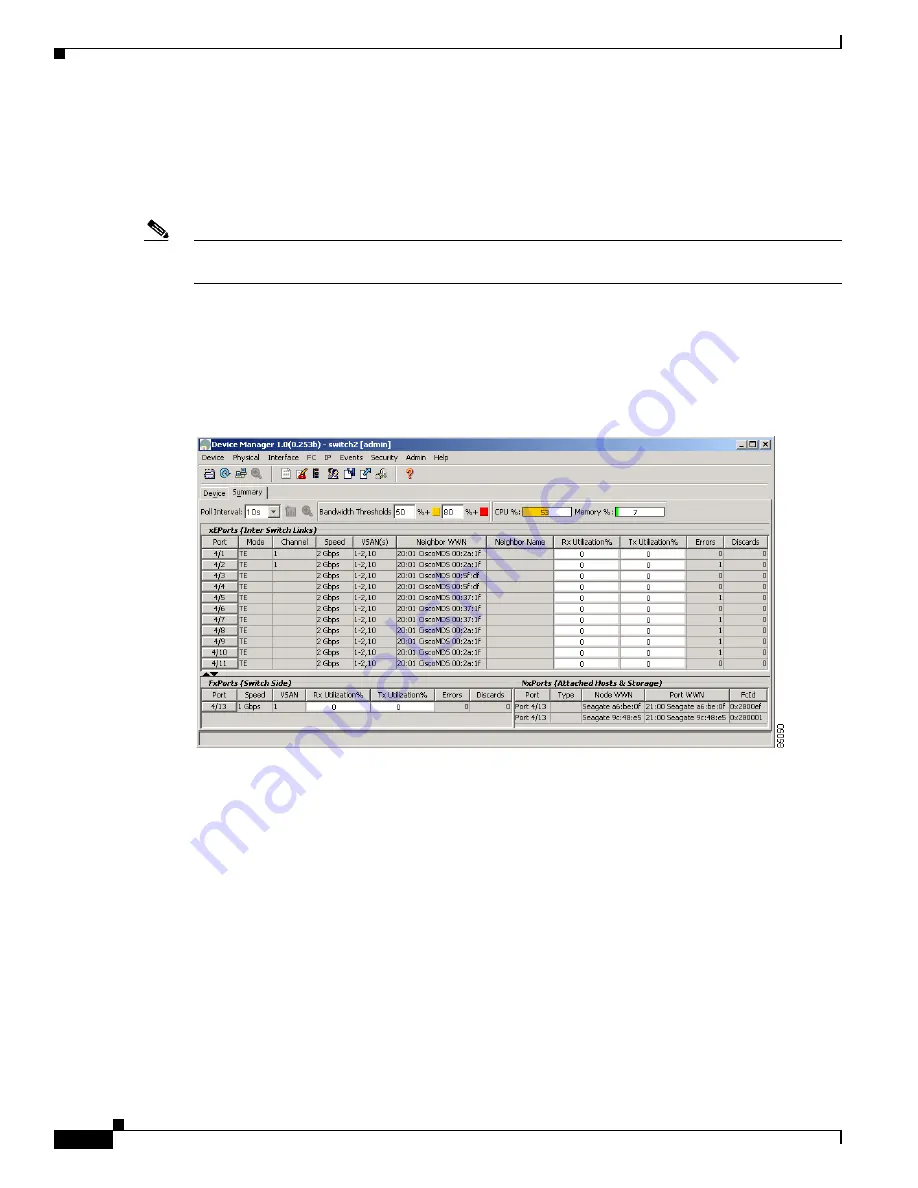
Figure B-2
shows the Device Manager Summary View window.
Figure B-2
Cisco Device Manager Summary View
The Summary View window lets you analyze switch performance issues, diagnose problems, and change
parameters to resolve problems or inconsistencies. This view shows aggregated statistics for the active
Supervisor Module and all switch ports. Information is presented in tabular or graphical formats, with
bar, line, area, and pie chart options. You can also use the Summary View to capture the current state of
information for export to a file or output to a printer.
Analyzing Switch Device Health
Choose the
Switch Health
option from the Fabric Manager Tools menu to determine the status of the
components of a specific switch.


