S e n d d o c u m e n t a t i o n c o m m e n t s t o m d s f e e d b a c k - d o c @ c i s c o . c o m
B-9
Cisco MDS 9000 Family Troubleshooting Guide, Release 3.x
OL-9285-05
Appendix B Troubleshooting Tools and Methodology
Using Cisco MDS 9000 Family Tools
Note
The ER state typically designates a process that has been restarted too many times, causing the system
to classify it as faulty and disable it.
Example B-3
show processes Command
switch#
show processes ?
cpu Show processes CPU Info
log Show information about process logs
memory Show processes Memory Info
switch#
show processes
PID State PC Start_cnt TTY Process
----- ----- -------- ----------- ---- -------------
. . .
457 S 2abaa76f 1 - portmap
1218 S 2acbac24 1 - licmgr
1249 S 2ade633e 1 - xbar_client
1250 S 2aca833e 1 - wwn
1251 S 2aebbc24 1 - vsan
1253 S 2ade433e 1 - ttyd
1254 S 2ac51ef4 1 - sysinfo
1255 S 2af7333e 1 - span
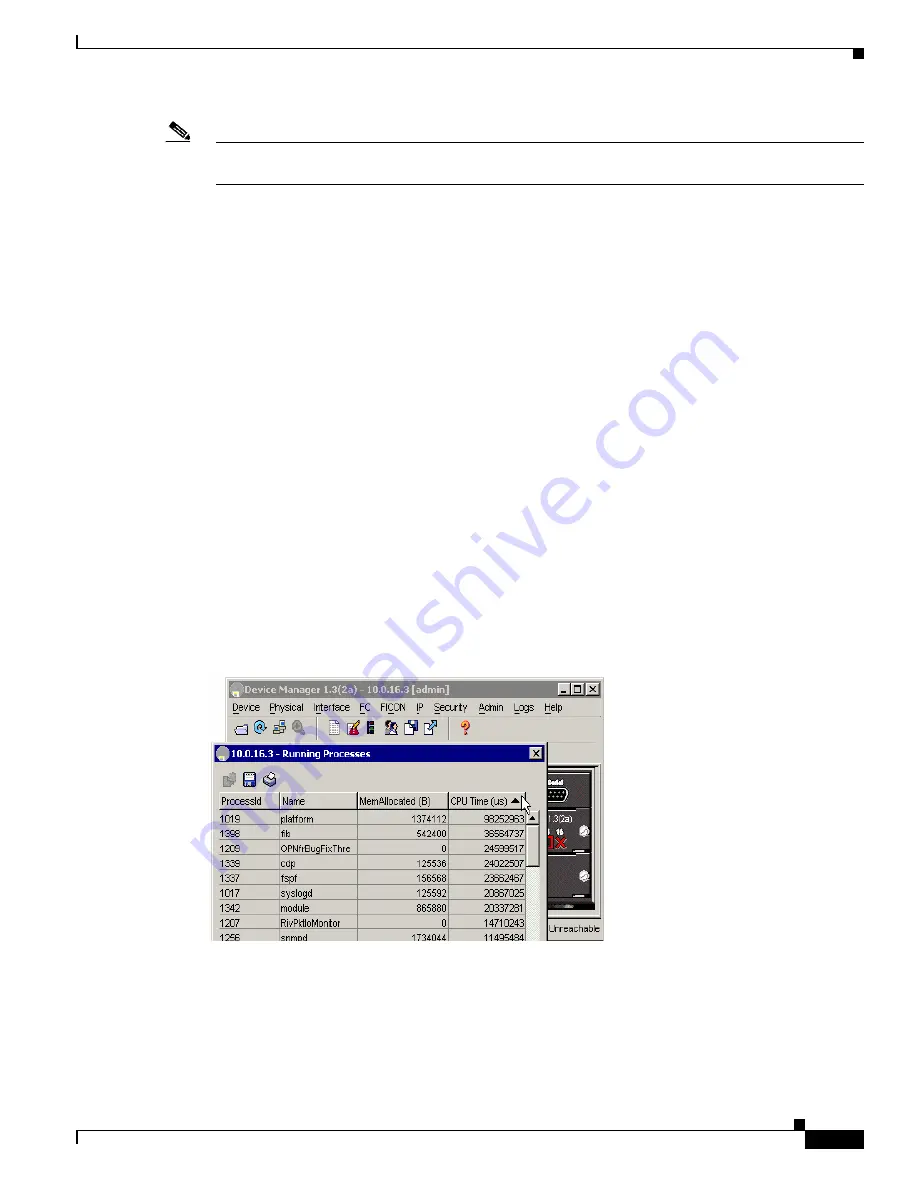
Viewing CPU Time In Device Manager
The Running Processes dialog display can be sorted based on any column header. To sort on CPU
utilization, click the CPU column header. An arrow in the column header indicates the order of CPU
utilization. Click the column header to toggle between ascending or descending order.
Example B-4
CPU Time Column Header
Using the show processes cpu CLI Command
Use the
show processes cpu
command to display CPU utilization. The command output includes:
•
Runtime(ms) = CPU time the process has used, expressed in milliseconds.
•
Invoked = number of times the process has been invoked.


