Operating Modes
Version 6.03, May 2017
Page 111 of 192
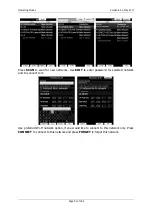
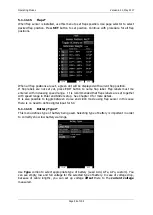
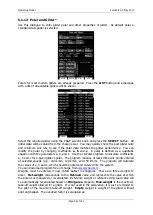
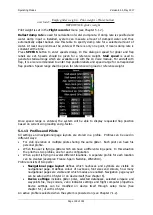
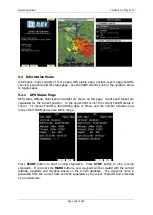
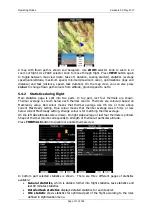
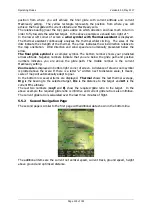
A map with flown path is shown and barogram. Use
ZOOM
selector knob to zoom in or
zoom out flight. Use PAGE selector knob to move through flight. Press
VIEW
button again
to toggle between map view (date, take off, duration, soaring started), statistics (average
speed/vario/altitude, maximum speed, minimum/maximum vario), optimizations (legs and
distance) and task (distance, speed, task duration). On the map view, you can also press
colour
to change flown path colours from altitude, ground speed to netto.
5.4.2
Statistics during flight
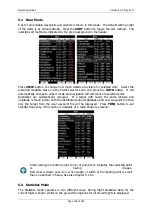
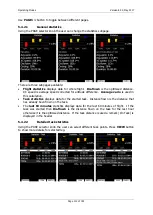
Main statistics page is split into two parts. In top part, last four thermals are shown.
Thermal average is shown below each thermal column. Thermals are coloured based on
MacCready value. Red colour means that thermal average was 0.5 m/s or more above
current MacCready setting. Blue colour means that thermal average was 0.5 m/s or less
below current MacCready setting. Orange colour is for matching thermal average.
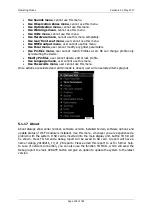
On the left side altitude scale is drawn. On right side average of last four thermals is printed.
Shape of thermal column corresponds to strength of thermal at particular altitude.
Press
THERMALS
button to disable or enable thermals view.
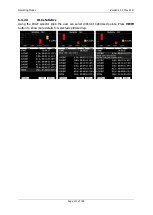
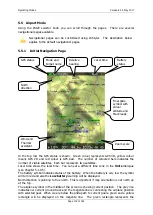
In bottom part selected statistics is shown. There are three different pages of statistics
available:
General statistics
, which is divided further into flight statistics, task statistics and
last 60 minutes statistics.
Detailed task statistics
displays detailed statistics for each task let.
OLC statistic
shows statistics for optimized part of the flight according to the rules
defined in Optimization menu.

