


Model 2461 Interactive SourceMeter® Instrument Reference Manual
Section 2: General operation
2461-901-01 A/November 2015
2-135
Using the swipe bar
The swipe bar at the bottom of the Graph tab shows which buffers are providing the displayed data,
the scale that is used, buffer statistics, and cursors.
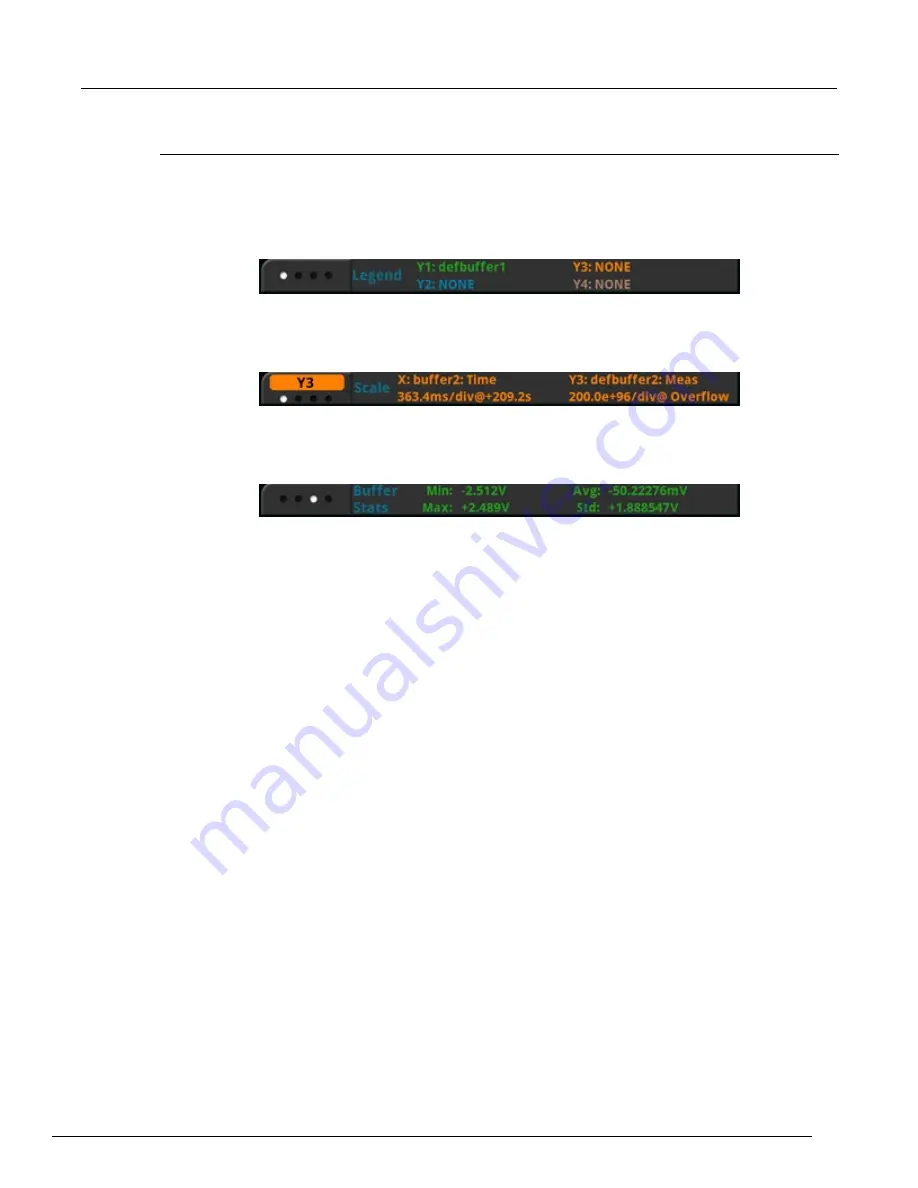
The Legend swipe lists each trace and the buffer that is providing the data for that trace.
Figure 79: Graph tab legend
The Scale swipe displays the scale for each trace. Select the trace button at the far left of the swipe
to view the scale for other traces.
Figure 80: Graph tab Scale swipe
The Buffer Stats swipe shows the minimum, maximum, average, and standard deviation data for
each trace.
Figure 81: Graph tab Buffers Stats swipe
The Cursor swipe allows you to set no, vertical, horizontal, or both cursors. When cursors are
displayed, the Cursor swipe displays the values of each cursor and the difference between values
between the cursors. Vertical cursors also show values of the data points near the cursor as V1 and
V2.
When cursors are displayed, you can drag them to change their positions. You can also move the
graph behind the cursors. To move the graph, select a portion of the graph that is not near a cursor
and drag. Note that you cannot use the navigation control to change cursor position.
If you have multiple traces selected, you can select the trace button on the lower left to display data
for the cursors as related to the selected trace. The cursor selects the nearest data and displays it as
V1 (left cursor) and V2 (right cursor).
Binning data with the Histogram
The histogram displays data from the active reading buffer in a bar graph with data organized into
bins. Data is binned until the statistics are cleared, the buffer is cleared, or a change to the histogram
scale settings occurs.
The legend at the bottom of the screen displays the reading buffer, buffer statistics, and the number
of bins.
If the top of a bin has a brighter green rectangle, there is additional data in the bin that is off the
screen.
You can change how the data is displayed:
•
Touch the screen with two fingers and pinch or zoom to change the scale of the displayed graph.
•
Select a histogram point to display the bin label and count.
•
Use the options in the Data and Scale tabs to change how data is displayed.